What are Bollinger Bands?
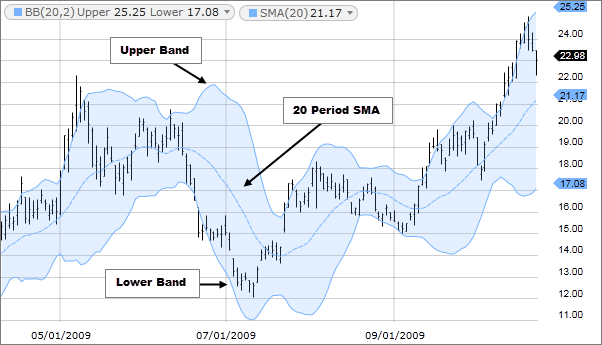
Bollinger Bands, developed by John Bollinger are a technical analysis tool. These are a kind of statistical chart that indicates volatility and prices over a specific time of a commodity or a financial instrument. They generate overbought and oversold signals. Bollinger bands have three lines which are the simple moving average or the middle band and a lower and upper band. The upper & lower bands are generally 2 standard deviations +/- from a twenty-day simple moving average and are adjustable.
Forex traders use these charts as an element of technical analysis. Bollinger bands are useful for trading decisions and help in controlling automated trading systems. The main objective of Bollinger Bands is providing a definition of high & low prices of any specific market. Typically, at the upper band, the prices are high. At the lower band, the prices are low. This is vital for pattern recognition and helpful for systematic trading decisions.
However, traders should know that Bollinger Bands are not a complete trading system. They are an indicator that helps traders with information about price volatility. John Bollinger recommends using the indicator along with 2-3 indicators that are non-correlated and provide direct market signals.

The typical values used in Bollinger Bonds are as follows.
- Short-term: Bands are at 1.5 standard deviations. It is a 10-day moving average
- Medium-term: Bands are at 2 standard deviations. It is a 20-day moving average.
- Long-term: Bands at 2.5 standard deviations. 50 day moving average.
History of Bollinger Bands
The famous teacher and financial trader John Bollinger created Bollinger Bands in the 1980s. The indicator was created with the objective of visualizing changes in volatility which is dynamic. However, quite surprisingly when Bollinger Bands were created, volatility was considered static. The technique used a moving average that had two trading bands – just above & below it. Bollinger Bands just add & subtract a standard deviation, which makes it different from a %age calculate from the normal moving average.
Over the years, Bollinger Bands became a popular technique. As per traders, more the price moves towards the upper band, the more overbought the market is. As the prices move to the lower band, the market is more oversold. John Bollinger has 22 rules to follow when traders use the Bollinger Bands for trading. Bollinger Bands can be applied almost all financial markets such as in Forex, futures, commodities, equities, and stocks. It is compatible with most time frames including hourly, daily, weekly, and monthly.
How Bollinger Bands Can Be Adjusted
Bollinger Bands measure price volatility and adjust themselves with changing market conditions. Therefore, traders find them useful as it’s easy to find all price data which is required between the 2 bands. Traders use it as part of technical analysis to plot trend lines. It helps traders to be aware of when to enter or exit a position. They can do this by identifying when a particular asset has been either oversold and overbought.
Apart from signaling changes in volatility, Bollinger Bands act as signals for buying and selling for many currency pairs. However, this can also result in frustrating losses and stop-outs. Traders should thus consider other factors when performing trades.
Applying the Bollinger Band indicator
To understand how we can apply the Bollinger Bands, we first have to understand how it works. Bollinger bands tend to tighten when experiencing a period of low volatility. The likelihood of a sharp price move in any direction increases, which may begin a trending move. Traders have to watch out for a false move which reverses before the trend begins in the opposite direction.
Volatility increases when the bands are separated by a significant range. Since prices have a tendency to swing between the bands, traders can use this for identifying profit targets. For instance, the upper band becomes the profit target when the price bounces off the lower band, crossing above the moving average.
Setting limits on Bollinger Bands
Each Bollinger band comes with upper and lower bands, set at a distance of two standard deviations from the currency’s 21 Day SMA. Traders can expect price movements anywhere between the two bands as they show the volatility of the price in relation to the average. Traders can thus use the bands to place buy orders at the lower band limit and place sell orders at the upper band limit. This strategy works well with currencies following a range pattern. It can however get costly for a trader in case of a breakout.
Basic Strategies using Bollinger Bands
As a trader using Bollinger Bands, he/she should be aware of what overbought and oversold signals are. In a chart, when the price reaches the upper band, the asset is overbought, which is trading at a relatively high price. This condition gives a bearish signal and the trader should exit all long positions to go short.
Similarly, when the price approaches the lower band in a chart, the asset is oversold. This generally produces a bullish signal. Here traders have to close their short positions, placing long orders instead.
Compared to other indicators, Bollinger Bands do not lag as much. Traders can analyze the strength of trends and the balance between bulls and bears. There several strategies traders can use with Bollinger bands. Two of the most popular ones are: Using market trends, and using Bollinger squeeze.
- Trending the Trend

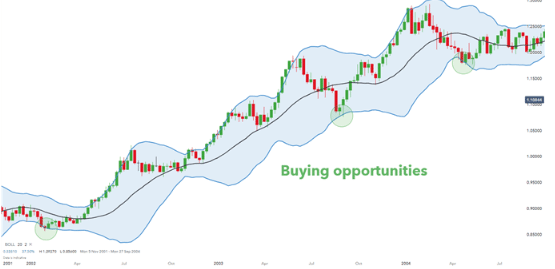
The above is a screenshot of the EUR/USD chart un an uptrend. This is depicted by the higher highs and higher lows. After applying the Bollinger bands, the lower band appears as a gauge of support. Traders can enter a long trade for buying when the price touches the lower band. Depending on the trend, traders can take profit from the upper and lower bands.
- Trading the Bollinger Squeeze

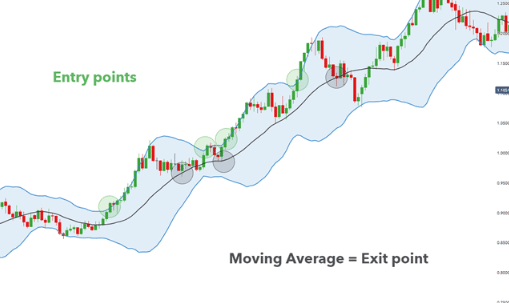
Bollinger bands contract when volatility is low and expands when it is high. This strategy involves looking for breakouts both below and above the band for use as entry signals. This depends on the trend.
In the above screenshot, the breakouts in an uptrend are highlighted in green. Traders will want to enter the green circles. The candles will follow the upper band after each entry. It indicates greater volatility when the bands expand after the breakout candle. Additionally, the black circles indicate exit points where traders look to place stops before looking out for further breakout signals.
The bottom line
Bollinger Bands are now a common tool, quite beneficial for traders helping them in trading decisions. They help in highlighting short-term prices in a specific security. When traders buy as currency prices go below the lower Bollinger Band, it helps them make the most of the oversold market condition and gain as the stock price gets back to the center moving-average line.
Thus, Bollinger Bands offer tremendous assistance to traders, helping them to determine the direction of the market and to decide what strategy to use. Their main usage lies in determining the direction of the market, as well as to trade trends.


