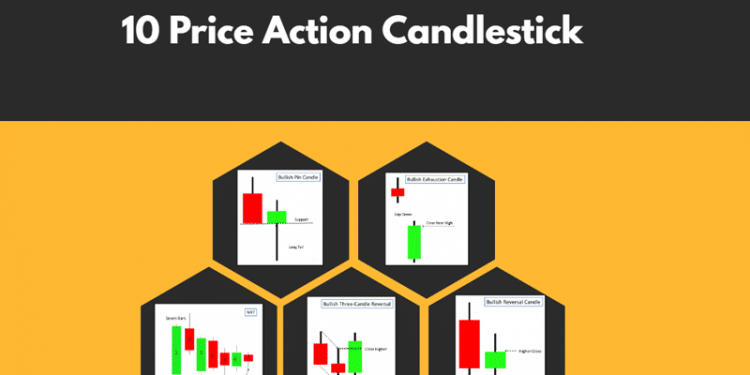
Candlestick charts form a crucial part of technical analysis in the market as they assist in forecasting the nature of price movements for traders. These candlesticks exhibit different patterns from time to time. By observing the candles, traders can make informed and credible decisions. Read further to understand how the common candlestick patterns are formed regularly and how you can use them.
- Doji:
The Doji pattern is formed when the open and the close prices for a security are almost equal. This results in a candle with varying upper and lower wicks that may look like a cross, an inverted cross or a plus sign. It generally has a short or almost non-existent body. The doji suggests a buyer/seller exchange mechanism with close competition keeping the prices similar on both sides.
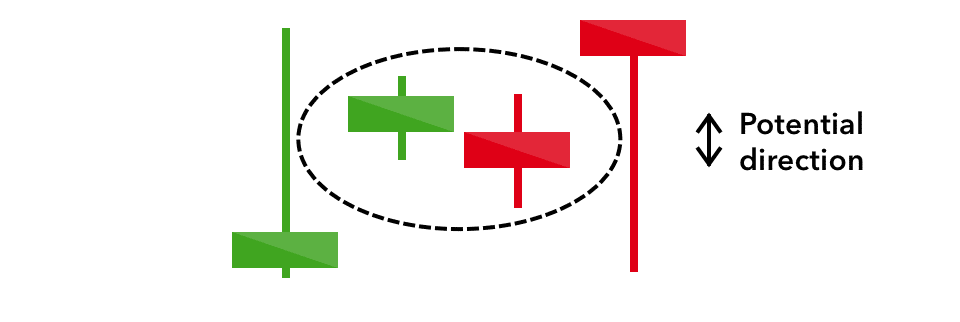
When a doji pattern occurs in a trend, the traders are hesitant to make decisions in trading as no particular party leads with a majority. Normally, it represents a trend reversal but you need to pair it with other candlesticks to get a better idea of the reversal to make a firm decision.
- Hammer:
Towards the end of a downward falling trend, the candlestick forms a pattern of a long wick below a short body. In a hammer, the security falls during the day after opening but finally closes near the open. It denotes an ultimate win on the buyers side that makes the prices go up in the end. The values of Open, High and close prices are almost equal in a hammer.
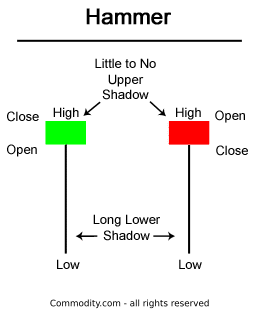
After a hammer candlestick, the prices go up as it signals a reversal from a downtrend. The upward movement is price confirmation for an uptrend. It is a cue for buyers to enter long and exit short positions after a hammer.
- Reverse Hammer:
A Reverse hammer represents a bullish market where the upper wick is long and the body is short. The wick is almost double the size of the body. After observing a buying pressure throughout the day, the selling pressure doesn’t succeed in bringing the price down at the end. After a reverse hammer, the buyers will soon have power over the market.
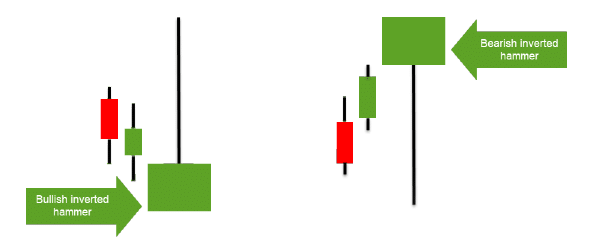
The Inverted bullish hammer occurs more frequently than the inverted bearish hammer. It is a signal for buyers to enter the market and encash the benefits of a rising uptrend.
- Marubozu:
Marubozu literally means ‘close-cut’ in Japanese. It forms a shape where the candle only has a body and usually no wick or shadow. Sometimes, a marubozu may have no wick either above or below it. It is an indicator of the strength of one side (buyer or seller) on a particular day.
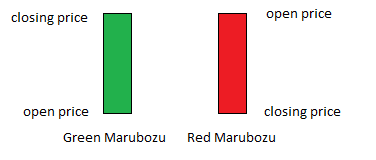
Experienced traders are on a constant lookout for marubozu candlesticks as they show certainty about particular trends. The advice is to take long positions when the marubozu is green and set the stop below the candle. Go short when it forms a red candle and set the stop above it.
- Harami:
Harami is a pattern created over two days where the body is reverse of the colour of the previous day observed. The second candle is embodied inside the previous day’s candle. Traders are recommended to apply the harami with multiple technical indicators to confirm a certain bearish or bullish harami alignment.
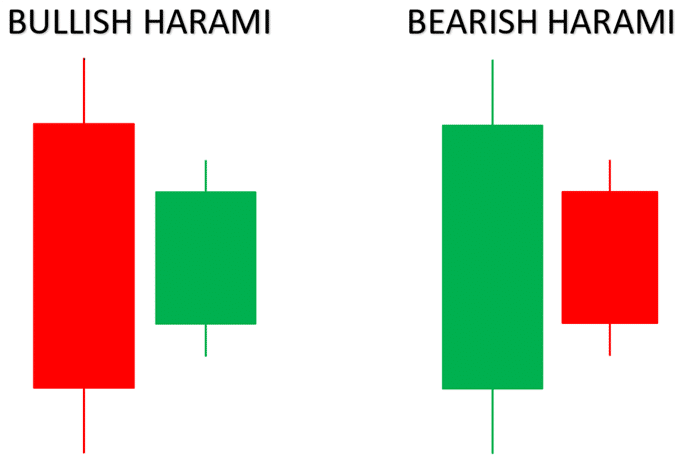
It is a marker of a reversal at the fall of a trend and should be treated likewise. For a bullish harami, the market trends upward and traders should open long positions and exit short. For a bearish harami, enter short positions and exit long when the downtrend lasts.
- Engulfing:
This pattern is formed by two candlesticks that denote the reversal of a trend. The second candle entirely accommodates the body of the first in the engulfing pattern. The candle can be bearish or bullish determined by the nature of the current trend. This decides the direction of the upcoming reversal.
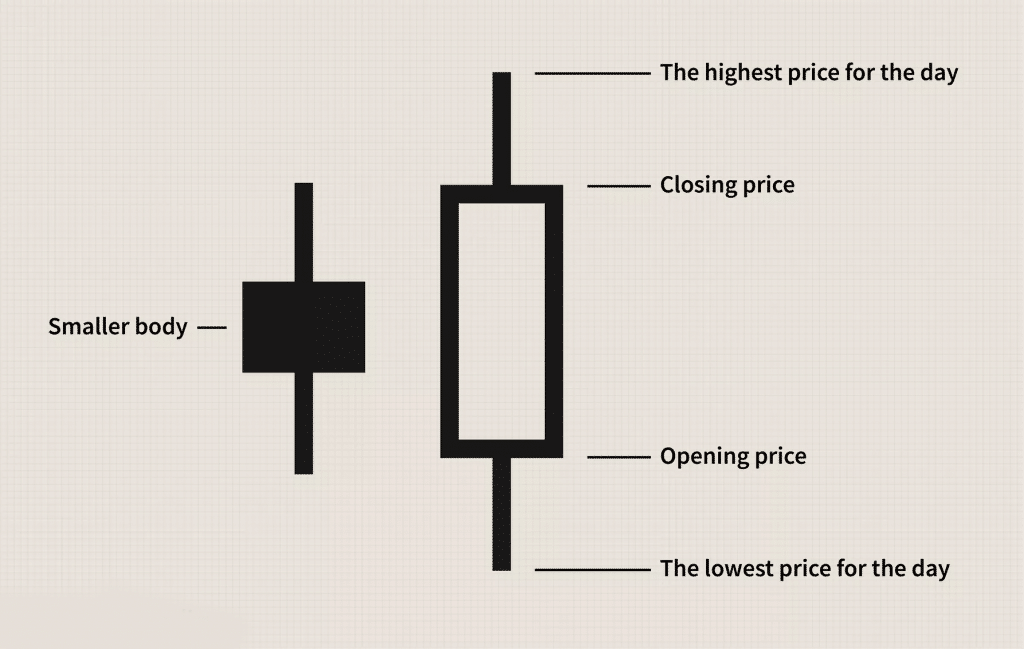
It gives a signal to traders to form entry and exit strategies before a trend starts. Traders can enter the trends early and enjoy lasting and stable uptrends or downtrends. For a bearish candle, you can enter short and place the stop loss above. Do the opposite for a bullish engulfing candle.
- Piercing Line:
It is also a pattern with two candles where a tall red candle is succeeded by a tall green candle. The values of the close of the first candle and the open of the second candle show considerable difference. This candlestick represents a short-term reversal to an uptrend after a downtrend.
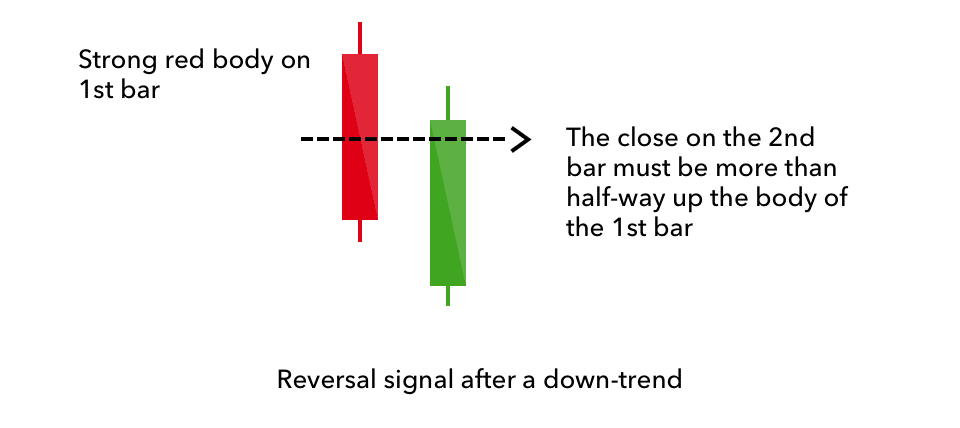
Traders should place the stop loss at the low of the previous day’s bearish candle. It is an optimal time for buyers to enter and enjoy the long uptrend.
- Hikkake:
Hikkake is a temporary pattern that can create either an upward or downtrend. A bullish hikkake pattern appears more often than a bearish hikkake. The pattern is made up of multiple candles that firstly form a harami pattern, a fake-out move followed by a reversal and breakout move.
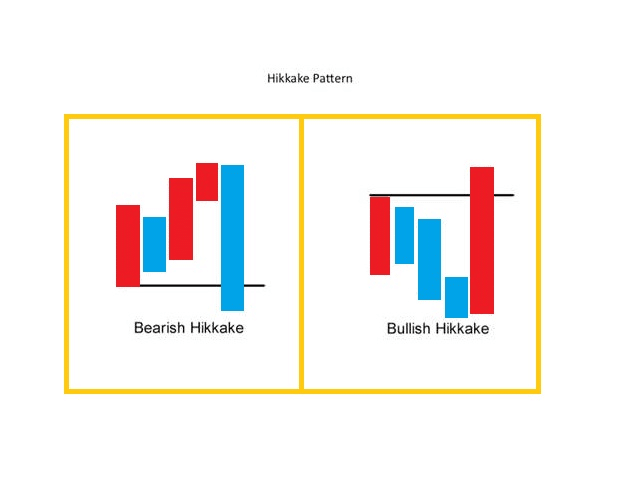
To trade a hikkake, traders need to place the buy stop at the high of the inside bar in a long setup. In a short setup, place the sell stop at the low of the inside bar.
- Three White Soldiers:
It is a bullish reversal pattern that appears at the end of a downtrend. The pattern is arranged by three rising green candles. The candles have tall bodies with either no wick or a very small wick. The opening price of the new candle is embodied inside the previous candle.
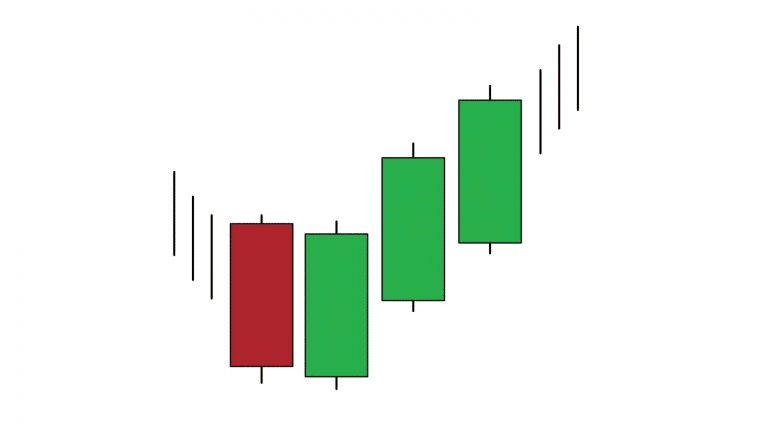
Traders believe it to be a sign to enter long positions for an uptrend combined with other indicators.
- Morning Star:
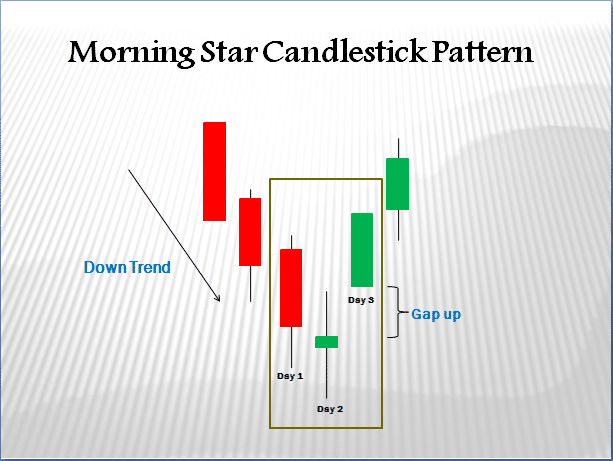
It is a bullish candlestick reversal pattern formed at the lowest point of a downtrend. It is arranged by three candles. The candle formed after the morning star establishes the arrival of an uptrend. The lowest point reached during the morning star is where traders should place their stop loss.
The Bottom Line
Always use multiple candlestick patterns paired with each other. Apply many technical indicators to gain certainty of trends and develop a comprehensive market analysis. Efficient risk management with use of proper tools is crucial to becoming a profitable trader.

