
Investors and traders have been using technical (mathematical) indicators for many years to help them interpret the market and thus obtain greater probabilities of success. Many of these indicators have changed or evolved, including new ones such as the Average True Range (ATR).

Being relatively new, the ATR was created in the late ’70s by J. Welles Wilder in his book “New Concepts in Technical Trading.” Welles was the first to talk about volatility as an indicator. His objective was to detect those stocks and commodities that had aggressive movements constantly to avoid them or learn how to invest in that specific asset.
Did you know some investors use the ATR indicator to diversify their portfolios according to the volatility of each asset? For example, they can diversify by trading more volatile currency pairs such as AUDJPY and less volatile ones like EURCHF.
Nowadays, investors can use this indicator to trade in any market, whether Forex, Stocks, or Commodities. So, this article will show you some strategies that you can trade using the ATR in currency pairs.
How ATR is interpreted
ATR’s primary use is to measure the volatility of a financial asset at specific times. It is interpreted in this way, if the oscillator rises significantly, the volatility in the price has increased. Conversely, if the oscillator falls, the volatility decreases. The following chart shows the movement of the ATR indicator in TradingView.
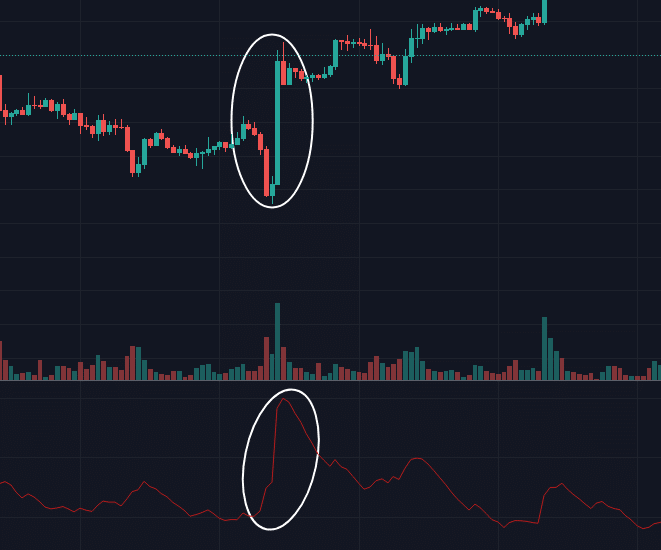
Notice how the oscillator moves aggressively upwards when the price increases its movement. It is essential to know that no matter the asset’s direction, the indicator will only show how much volatility is generated in that movement.
How ATR can help in your investments
One of the many features worth noting is that it serves to diversify your investment portfolio. For example, let’s say you want to divide 50 thousand dollars into five different stocks or currency pairs based on the volatility analysis in a certain period. Choosing assets with varying levels of volatility can help your portfolio avoid significant losses.
Strategies with the ATR
There are many options for trading with the ATR, either alone to help you with price action or to help you with volume, strength, or trend indicators. Let’s look at some examples.
Identify the beginnings of trends
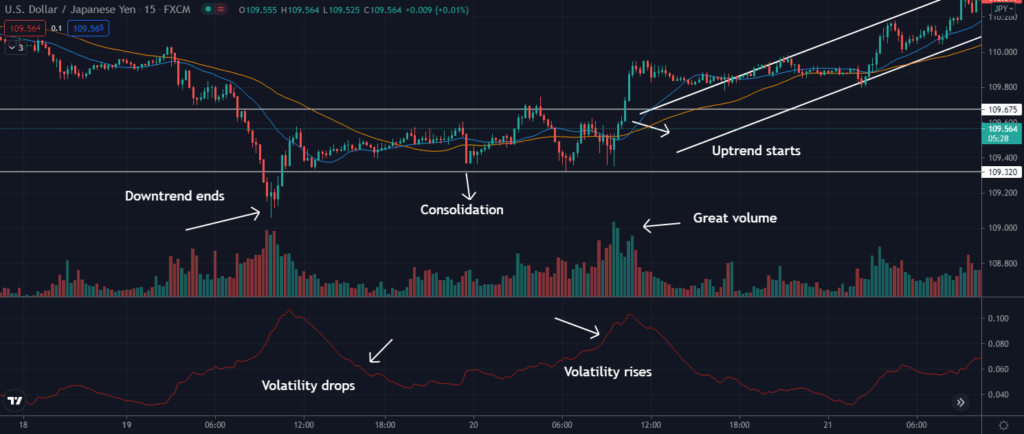
The ATR cannot measure the strength of a trend by itself, but it can help to anticipate the beginning of a movement. Let’s look at an example in the following chart of the USDJPY pair.
After a period of consolidation with low volume, there is the first impulse with higher volume. Usually, along with the first impulse, the ATR increases, indicating volatility and the beginning of the uptrend. The idea is to take a long position at the breakout of the consolidation phase.
Suppose you missed the entry at the range breakout. In that case, you can use Simple Moving Averages such as the 20-period Moving Average depicted in blue and the 50-period Moving Average in yellow to enter the retracement.
For example, look at the following chart.
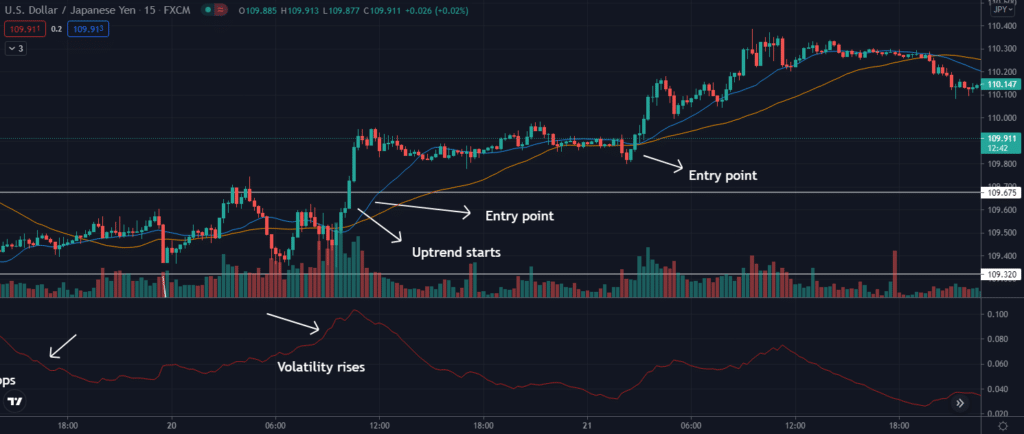
You can buy when the price gets back above the MAs.
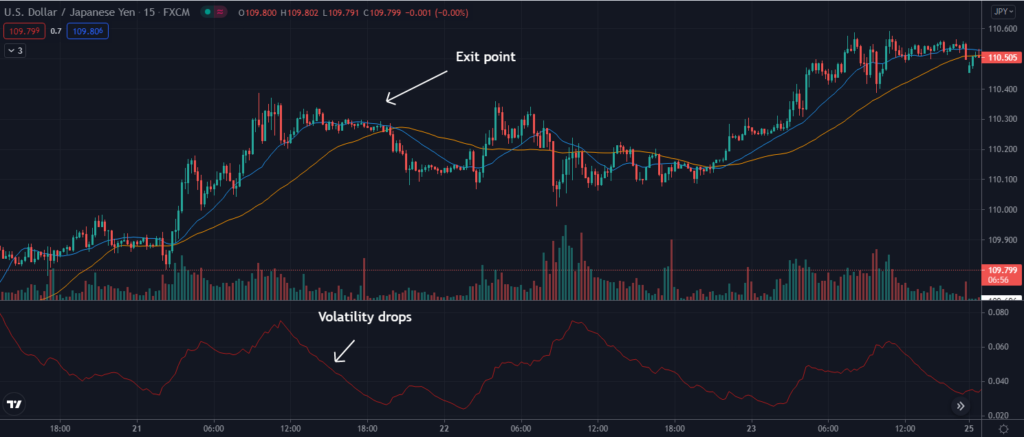
To know the exit point, observe when the ATR decreases notably in a previous resistance zone or according to the profits you obtained.
Identify divergences with ATR + Squeeze Momentum Indicator
Reversal trading can be risky. However, if we can recognize divergences, we can make good profits. An example is shown in the following chart.
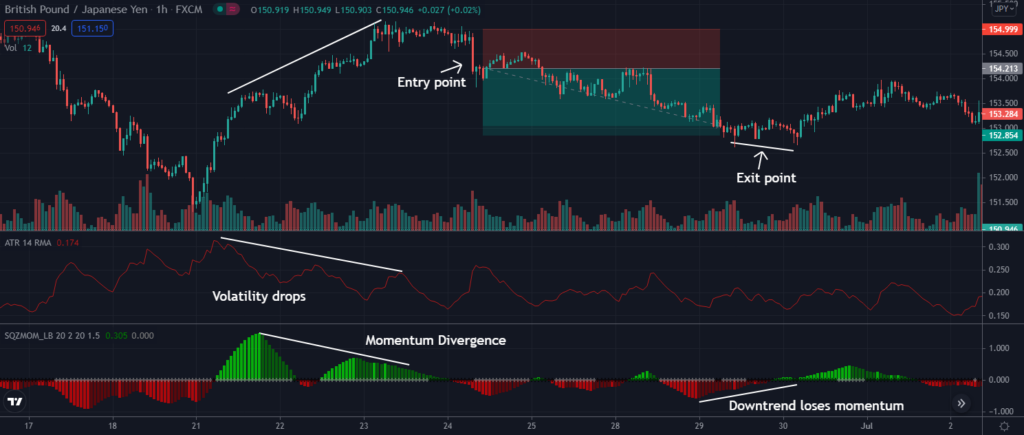
The price had been making new highs; however, momentum and volatility were decreasing. These signals indicate that the trend is running out of steam, so we must be prepared to enter a reversal, in this case with a short position. You can wait for a confirmation of a big red candle to enter the market.
You can wait for another divergence or when price touches your take profit point to close the trade.
Range breakouts with ATR + volume
Another strategy that you can apply and that may generate profitability is trading range breakouts. The first thing you should do is mark the range and wait for the breakout to occur to analyze volatility and volume.
Let’s see an example with the GBPJPY pair in the chart below.
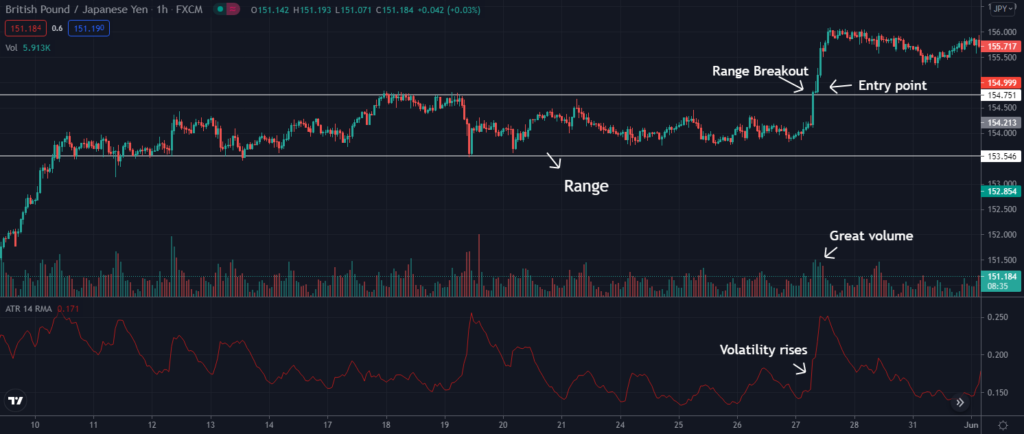
An important tip is that you have to be attentive to the breakout candle. If the close of this candle ends above or below the range, i.e., above support or below resistance, it is a possible confirmation of a range breakout.
Bonus tip: ATR trailing stop loss
Placing the stop loss point is sometimes complicated. However, the ATR can help you, and it will depend mainly on the volatility of the asset.
A rule of thumb is to multiply the ATR by two to determine a reasonable stop loss point. So, if you’re long in a currency pair, you might place a stop loss at a level twice the ATR below the entry price. On the other hand, you should put a stop loss at a level twice the ATR above the entry price if you’re shorting.
For example, say you take a long trade at $10, and the ATR is $0.10. You would place a stop loss at $9.80 ($10-2*$0.10).
Conclusion
First of all, you should understand that the purpose of using indicators should not be to predict the next price movement but to have a better odds of the market going in a particular direction. Remember that trading is all about probabilities.
The ATR is a very versatile tool. It’s helpful, especially during the increased volatility in the currency pair when important economic or political news is announced.
Also, some expert traders consider that ATR is not a suitable indicator for instruments that usually present high volatility. However, you can use this indicator on any asset, whether it is volatile or not, as long as you continue to manage your risk properly.

