Swing trading is a strategy which aims at identifying a trend and realizing gains within a few days or weeks. It is the opposite of long-term trading, which aims at benefiting from trends within a few months. It is also slightly different with day trading, which looks at opening and exiting trades within a day. Swing traders use different trading strategies, including candlestick analysis, Elliot wave, price action, and technical analysis. In this report, we will look at the best swing trading indicators you should consider using.
Exponential moving average
Moving averages are among the most popular technical indicators in the market. Indeed, they form the foundation of several other popular indicators like envelopes, moving average convergence and divergence (MACD), and Bollinger Bands.
There are several types of moving averages, including simple moving average (SMA), exponential moving average (EMA), Hull moving averages, smoothed MA, and Arnaud Legoux MA. Of all these, I prefer using the EMA for swing trading because it usually removes the lag by having more weight to the recent price.
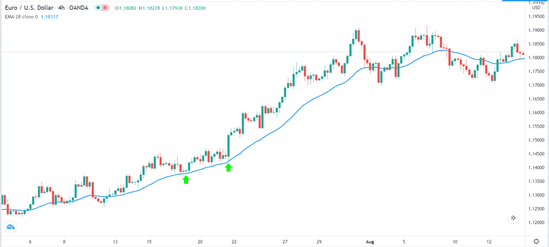
Swing traders use the EMA in various ways. First, there are those who use it to follow a trend. For example, a 28-period EMA is used in the EUR/USD pair below. As you can see, the upward trend persisted so long as the price was above this moving average. In this case, a sell signal usually emerges when the price moves below the average.
Using the EMA in trend following
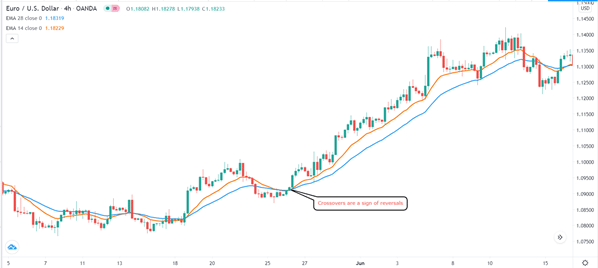
Swing traders also use the EMA to identify reversals. A popular way to do this is to combine a longer (slow) and a shorter (fast) moving average. In this case, a reversal signal usually emerges when the two averages make a crossover. An example is shown in the EUR/USD pair below.
Using EMA to identify a crossover
Ichimoku cloud
Ichimoku cloud is also known as Ichimoku Kinko Hyo. It is old and also one of the best swing trading indicators in the market. The indicator is made up of five lines that are known as, chikouspan (lagging span) Kijun-sen (base line), tenkan-sen (conversion line), senkou span A (leading span A), and senkou span B (leading span B).
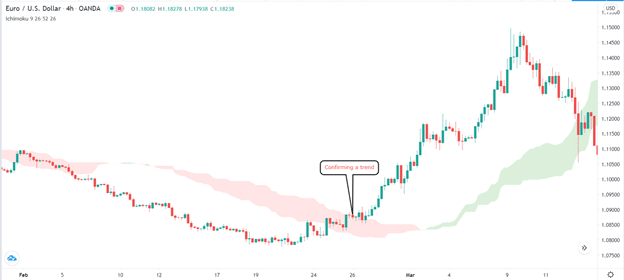
Traders use the Ichimoku Kinko Hyo indicator to identify new trends, confirm a consolidation phase, and to identify a reversal. They do this in several ways. First, they use the cloud to confirm that a trend has formed. For example, in the chart below, we see that the EUR/USD was in the process of starting an upward trend. To confirm that a new trend is indeed forming, the trader can look at a time when the price moves above the red cloud. The trend is further confirmed if the trend changes colour.
Ichimoku cloud crossover
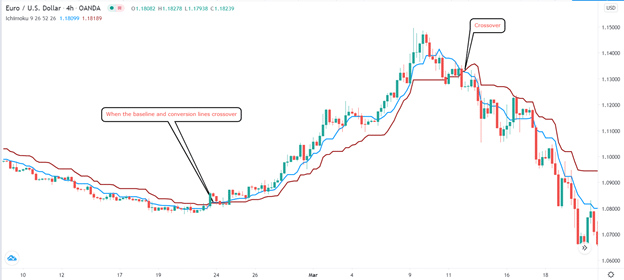
Another strategy to identify buy and sell signals using Ichimoku cloud involves removing the clouds and remaining with the conversion and baselines. In this, a buy signal emerges when the two lines make a crossover as shown below.
Ichimoku baseline and conversion lines crossover
Relative Strength Index (RSI)
The Relative Strength Index is a popular swing trading that is used mostly to identify overbought and oversold situations. It was developed by Welles Wilder, who also developed other indicators like the Parabolic SAR and the Average True Range (ATR). The RSI usually ranges from zero to 100.
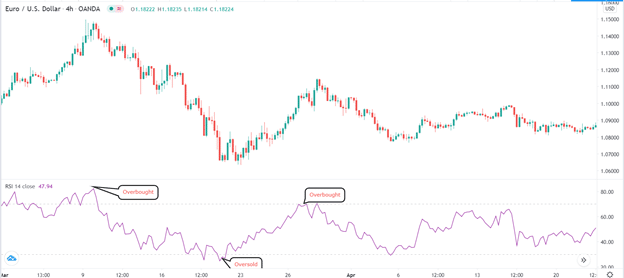
Traders use the RSI in several ways. First, they use it to identify overstretched situations in a currency pair or stock. Basically, they use the 30 level as the oversold level and the 70 level as the overbought level. Therefore, whenever an asset reaches the oversold level, they take it as a buy signal, and vice versa.
A good example of this is in the EUR/USD pair below. As you can see, the pair starts to decline when the RSI is in the overbought level. Also, a reversal happens when it is in the oversold level.
Example of the RSI indicator
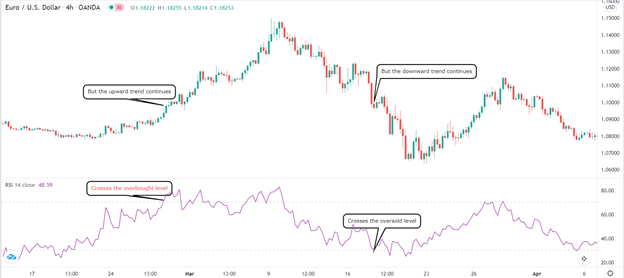
There are two main things you need to know when using the RSI in swing trading. First, the period is an important part of the indicator. Most trading platforms have the period set at 14 by default but you can change it to suit your trading style. Second, you should be careful about the overbought and oversold levels. That is because, in some cases, the price tends to continue the trend even after the two levels are reached. The secret to using it well is to wait until a reversal pattern is defined well. A good example of this is shown below.
Need for caution when using RSI
Money Flow Index (MFI)
Money Flow Index (MFI) is a volume-based indicator that is relatively similar to the Relative Strength Index (RSI). Indeed, it is also known as the average-weighted RSI. Developed by Gene Quong, the indicator is used in swing trading to identify extreme levels.
The index is calculated by first calculating the typical price, which is the addition of the high, low, and close price divided by three. You then calculate the Raw Money Flow by multiplying the typical price with the volume. Next, you calculate the money flow ratio by dividing the positive and negative money flow. Finally, to calculate the MFI, you use the following formula:
MFI = 100 – 100/ (1+ money flow ratio).
Like the RSI, the MFI ranges between 0 and 100. The overbought levels start at 80 while the oversold levels start at 20. A good example of this is in the EUR/USD pair below.
MFI example
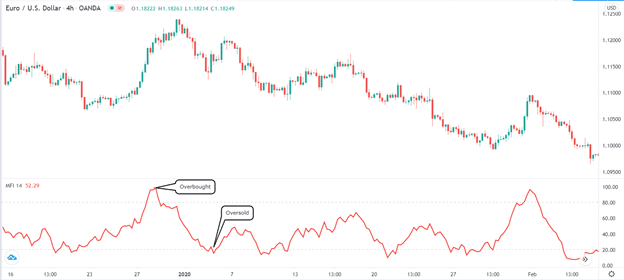
Like the RSI, the MFI can send the wrong signals. The price can continue to drop even after it hits the oversold level. A key secret to deal with this is to use the MFI with other indicators like the moving averages. Also, it is important that you tweak the period depending on your trading strategy.
Bollinger Bands
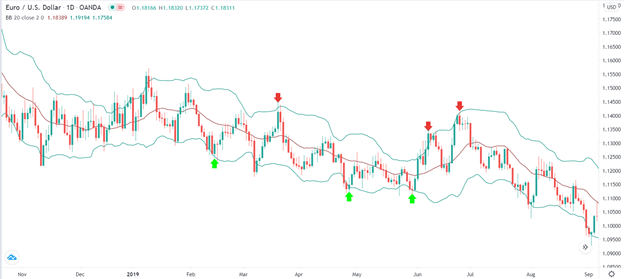
Bollinger bands is a popular trend and volatility indicator. The indicator has three lines, with the middle one being the 20-day simple moving average (SMA). The upper and lower lines are the 2 standard deviations above and below the middle line. Traders use it in swing trading in various ways.
First, they use it to map the strength of the trend. In a very strong upward trend, the price is usually along the upper line of the Bollinger band. Similarly, in a very strong downward trend, the price is usually along the lower line of the band.
Another strategy is to identify support and resistance. In this, they buy when the price reaches the lower line of the bands and short when it reaches the upper side as shown below.
Final thoughts
Technical traders are essential tools in swing trading. However, all indicators we have mentioned above have their limitations. For example, the price may continue rising even after the RSI becomes extremely overbought. To reduce these limitations, we recommend that you use a combination of several indicators to confirm a trend or reversal.

