A successful foray into Forex depends on how well you learn to assess the strengths and weaknesses that prevail in the market. To understand the movements of assets and capitalize on them, it is necessary to know about tools like technical indicators. Learn more about technical indicators and the different types of analytic tools used in Forex in this article.
What Are Forex Technical Indicators?
These are tools that utilize mathematical calculations and display market data statistics of the past to help traders confirm price momentum. There are several types of technical indicators used in Forex. Here is a quick view on each of them.
Trend Following Indicators
How strong the present market movement is and its direction can be found using the trend following indicators. Some common types under this category include:
Moving Average
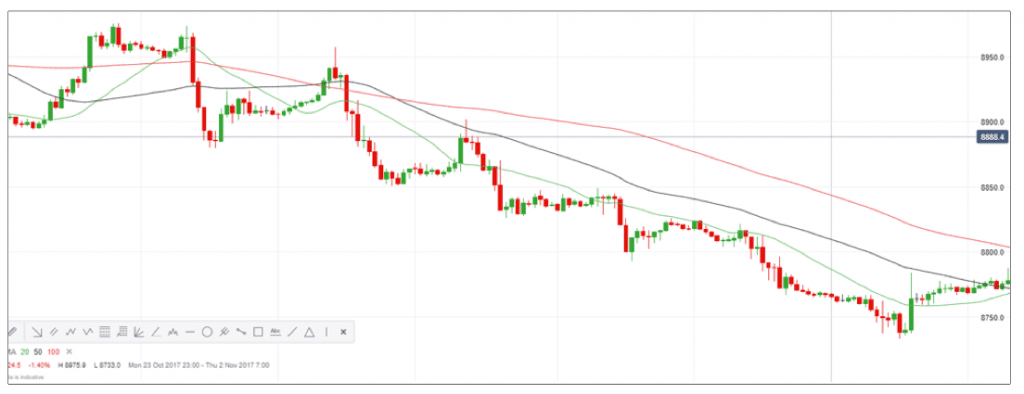
As the most common indicator employed by traders, there are two key types, namely:
- Simple moving average (SMA)
- Exponential Moving Average (EMA)
SMA belongs to the lagging category, which means it predicts the movement only after it happens. It helps assess the direction of the price movement. Trades can be taken when the crossover occurs between two SMAs. They also work as support and resistance. These do not work alone and should be used in collaboration with a leading indicator.
EMA focuses on current data and makes it respond to new data. Traders can use EMA to confirm important market moves and verify their position.
Ichimoku Cloud
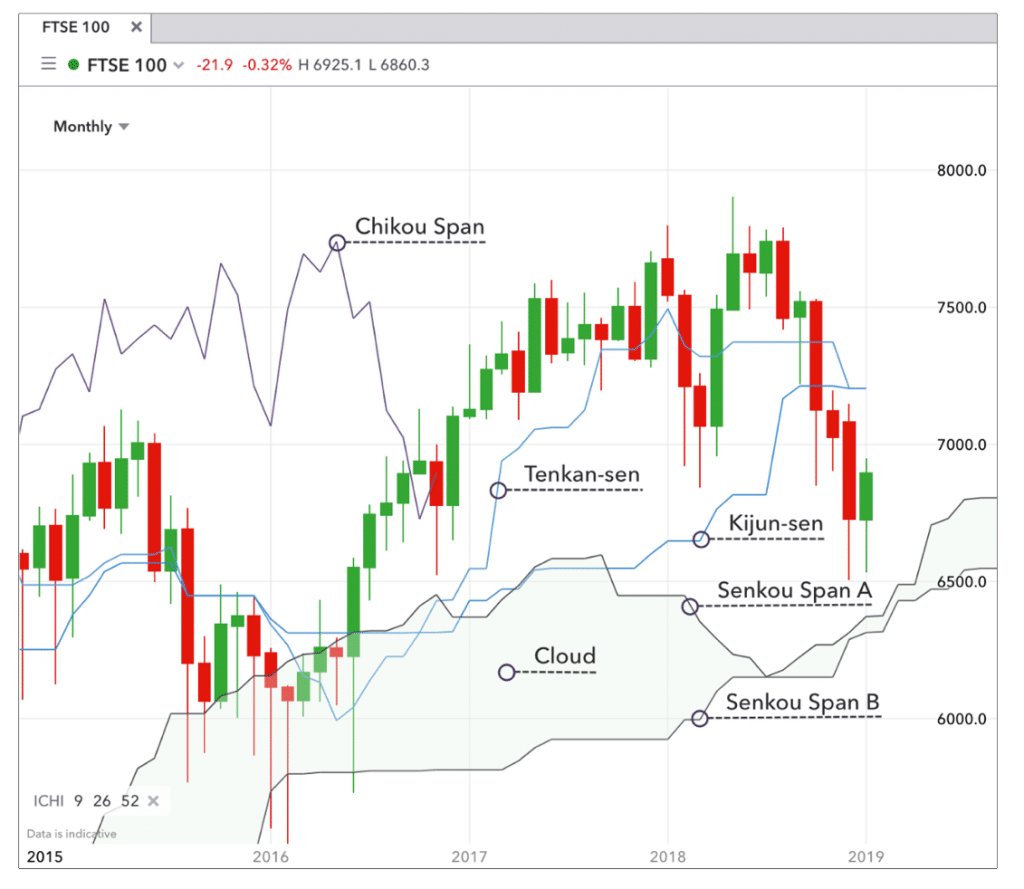
Also named Ichimoku Kinko Hyo, this indicator helps in assessing the direction of the trend. It is ideal in trending markets. You can also find the resistance/support and asset momentum with the indicator. It is made of five components, namely Tenkan-Sen, Kijun-Sen, chikou Span, Senkou Span A, and Span B.
The lagging indicator helps to identify uptrends and downtrends. To buy, you need the price to break and end over the cloud and for the conversion line to cross over the baseline. The buying decision should be at a point after the crossover with the stop loss set under the breakout candle.
Average Directional Movement Index (ADX)
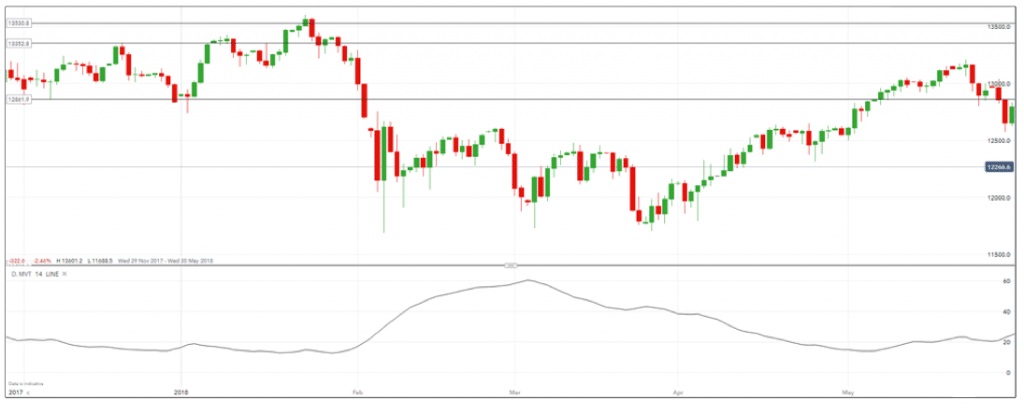
When you want to assess the price trend strength, ADX is ideal. It can help indicate the continuation of a trend direction. Calibrated from 0 up to 100, a reading above 25 indicates a robust trend and below 25 indicates a drift. This index surges when there is a fall in prices, which indicates a robust trend in a downward direction.
Moving Average Convergence/Divergence
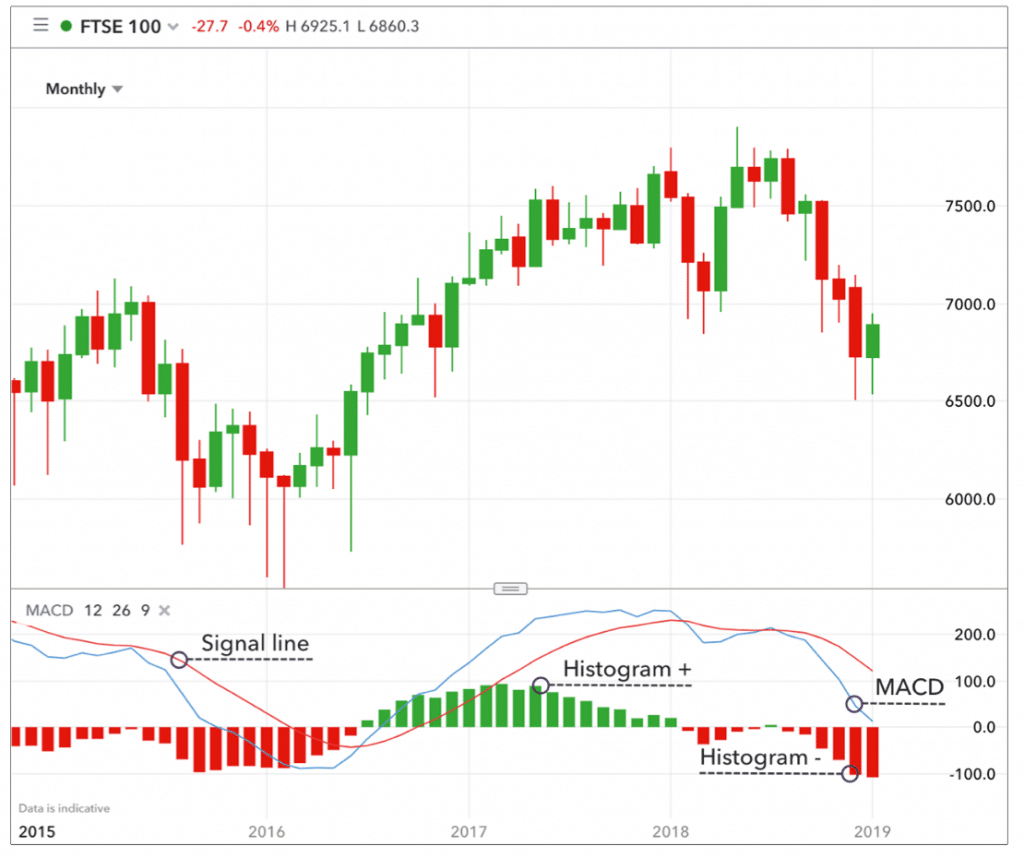
For verifying the movement of price, its direction, and trend, the MACD indicator is ideal.
Its components are:
- Signal line
- MACD line
- Histogram
The closing prices of two exponential moving averages are used for the calculation of this lagging indicator.
Momentum/Oscillator Indicators
When you find indicators bound by two values of extreme nature reflecting overselling or overbuying over the short term, they are termed oscillators. Let us see the common oscillators here.
Relative Strength Index
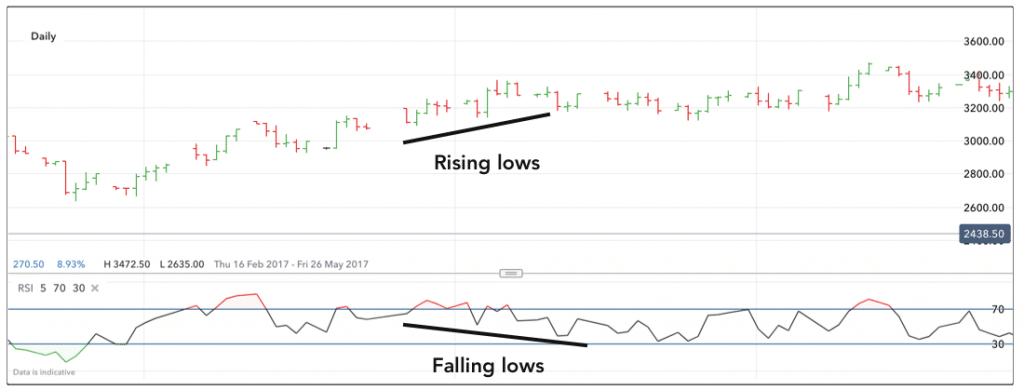
Also termed momentum indicator, it can help measure the historic changes in the price and assess whether extreme buying or selling conditions are prevailing in an asset. The calculation uses exponential moving averages. This makes it more consistent even if it is a lagging signal.
So, when you find an RSI value above 70, it indicates the overbought condition, which is when you should look at selling opportunities. And, a value below 30 indicates the oversold condition of an asset, which is when you should consider buying.
Stochastics
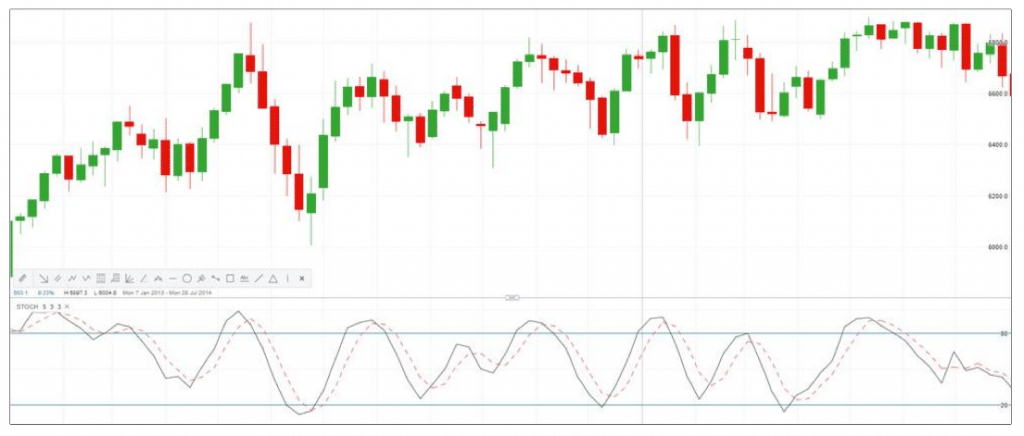
When a trader wants to compare an asset’s closing price to the price of the asset over a particular span, this indicator is handy. This is another lagging indicator whose value should be taken as a signal of not being oversold or overbought.
So, a value above 80 implies that the asset is not overbought. And, a value under 30 implies that it is not oversold. This may confuse traders and make them mess their orders.
So, consider a selling opportunity only when the value drops below 80 and you use a leading signal for confirmation. Buy only when the value is under 20 and it has crossed upwards. This indicator is ideal for a trending market.
Commodity Channel Index (CCI)
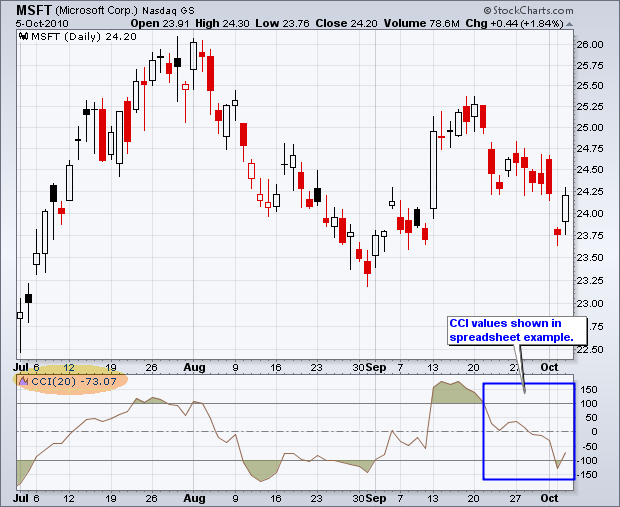
This index differs from other oscillators by the absence of high and low limits. 0 is used as the center point and overbought levels begin as +100, while oversold markers are from -100. The sell sign is when breaks occur below +100 and buy when breaks are above -100.
Volatility Indicators
The magnitude of an upswing and downswing of a specific currency pair is measured using the volatility indicators. A pair that fluctuates strongly has high volatility, while very little fluctuation indicates a low level of volatility.
Average True Range (ATR)
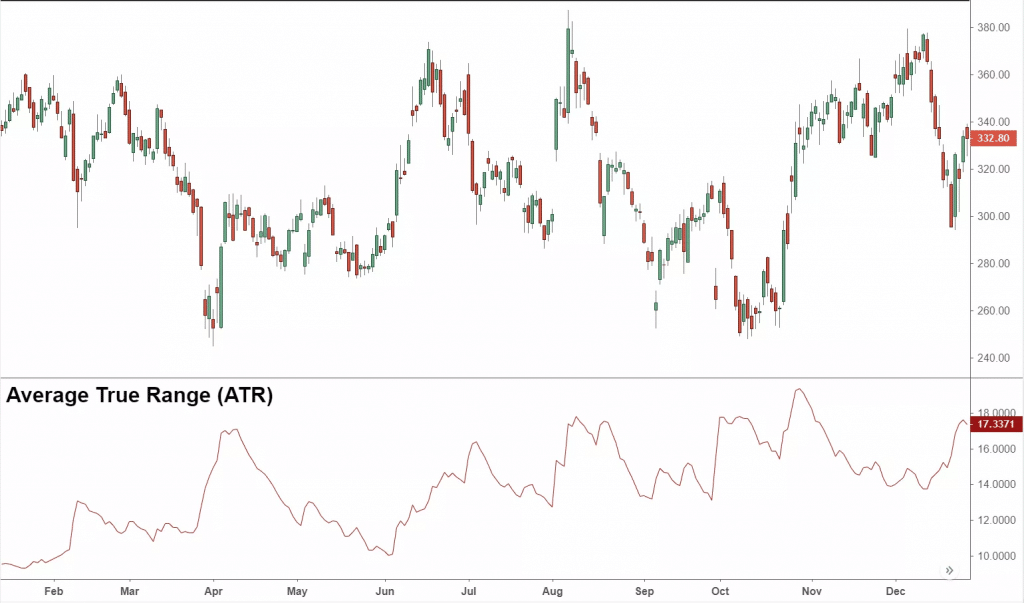
As the name suggests, this indicator reveals the mean distance present between two extreme price levels over a typical set of 14 bars. A high ATR indicates high volatility and a low value reveals low volatility. Pips are used to represent the indicator.
Bollinger Bands
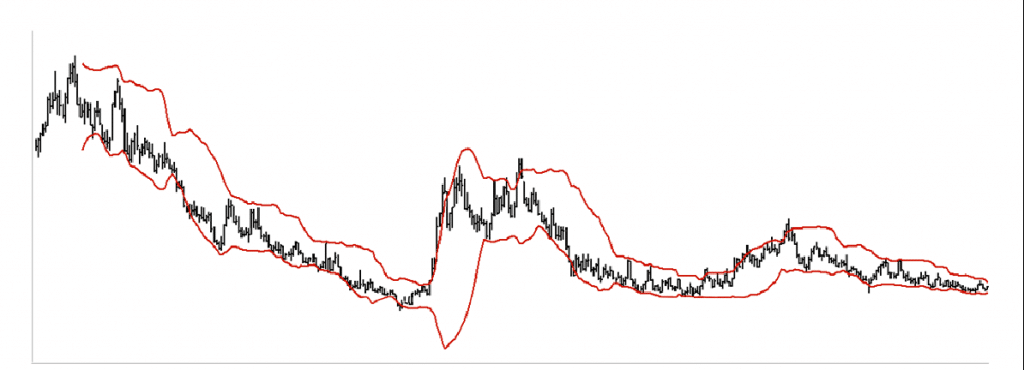
This consists of three lines printed on the top portion of a price chart. Upper and lower lines/bands indicate two standard deviations over and under the 20-span moving average, while the middle line/band is the 20 MA. With high volatility, the outer bands turn wider.
Support/Resistance Indicators
As a vital part of the analysis, support and resistance indicators reveal price stops that act as a barrier to a movement of an asset in a particular direction.
Pivot Points
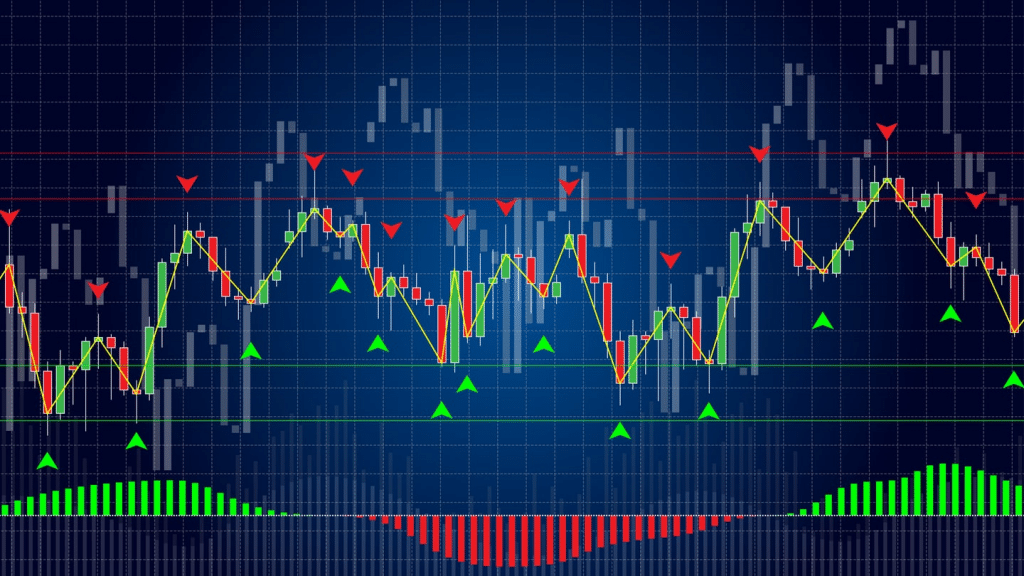
This indicator is used prevalently in commodities and equities markets besides Forex. The indicator is evaluated with a formula that uses the closing values, low values, and high values of the previous span. The lines here are used as probable barrier levels that the price can find difficult to cross.
Donchian Channels
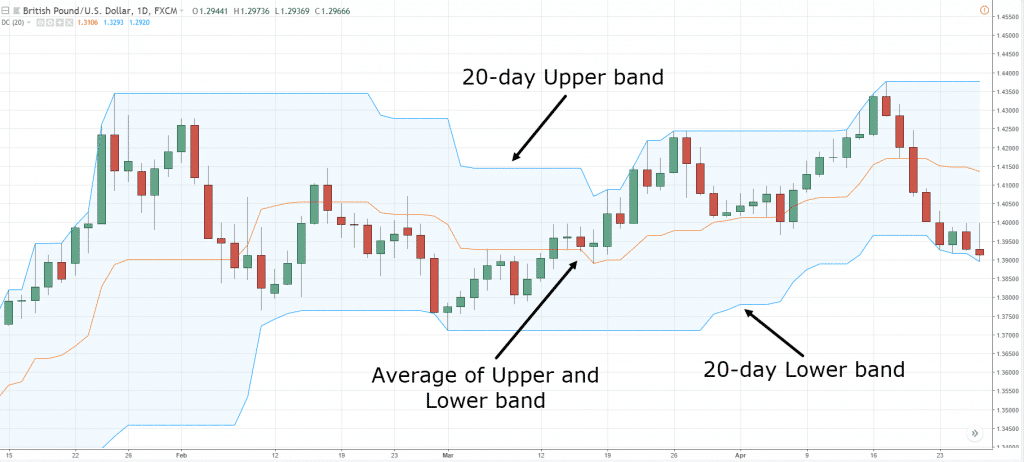
Also called price channels, these are lines drawn over and under a new price movement. The lines indicate high and low values over a longer span. When the price touches these lines, they act as resistance or support.
Volume Indicators
Volume indicators help in identifying the price changes over a specific span. The indicator is present as a separate window under the price chart with the transacted volume being shown in color-coded bars.
On-Balance Volume (OBV)
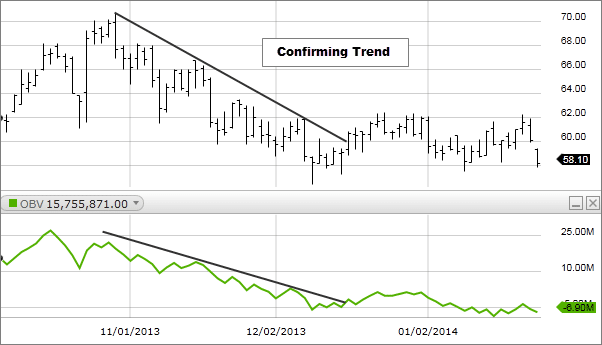
OBV helps measure the selling and buying pressure by adding the volume on upward trend days and subtracting the volume on downward trend days. An entire trading day’s volume is measured as the down volume when an asset closes at a lower value than the previous closing level.
Summary
For successful trading, it is necessary to use an appropriate indicator. You have to take into account the numbers and statistics that these indicators reveal and how they help in your trading method. Remember that an indicator should not be used individually or in groups.
You need to choose a select few that suit your trading objectives. It is also important to use your own evaluation of the price movements. For confirmation of a price signal, it is best to use the indicators and price movement information until you confirm the signal.


