
The Accumulative Swing Index was developed to decipher the swing line within a bar. Popularly known as the ASI, it is a technical indicator used to assess the performance of an asset’s pricing. It depicts long term trends in the price of a security and was developed by Welles Wilder.

What is the Accumulative Swing Index (ASI)?
The ASI uses the asset’s high price, low price, open, and closing price to determine the long-term trend. By definition, it is simply the grouping of the swing index. Both the ASI and the swing index were developed by Welles Wilder. It is particularly useful to decipher buy and sell signals for market analysts – that is, it is commonly used as a tool to distinguish confirmation and divergence.
Graphically, the ASI appears as a trend line. It is a useful tool in checking for breakouts in the price line. You can develop support and resistance levels using this indicator. Traders also use the ASI to observe trend momentum and possible reversals in the market.
Calculation and example
To develop the Accumulative Swing Index, Wilder used the swing index which he had created earlier. The swing index can be computed as follows:
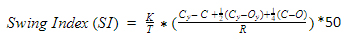
Where,
T = Highest number of price fluctuation observed during the day
C = Present Closing Price
O = Present Opening Price
Cy= Previous Closing Price
Oy= Previous Opening Price
The value of K is calculated as follows:
K = whichever is greater between the difference of Hy – C, or Ly -C, where:
Hy = Previous High Price
Ly = Previous Low Price
The Value of R is calculated in two stages.
First, calculate whichever is the highest amongst the following values:
- H – Cy
- L – Cy
- H – L
H = Current High Price
L = Current Low Price
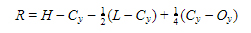
If the value of H-Cy is highest, then R is calculated as follows:
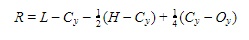
If the value of L-Cy is highest, then R is calculated as follows:
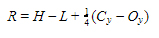
If the value of H-L is highest, R is calculated as follows:
Now, compute a cumulative figure of the swing index to follow the dynamics of the accumulative swing index for a security by taking the values of the index for several consecutive days.
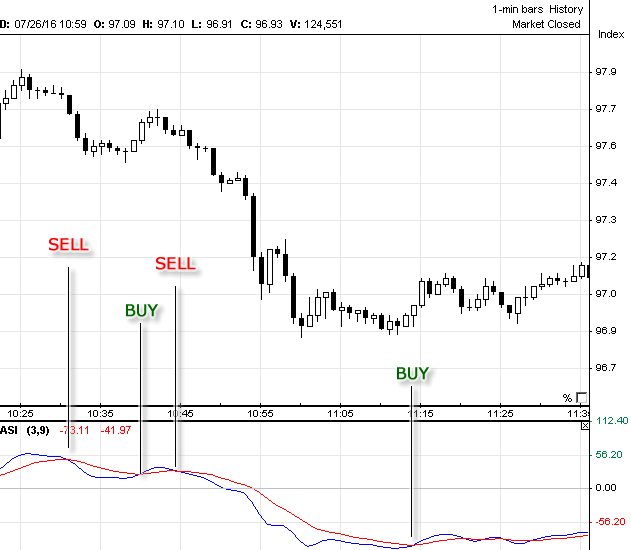
In the graph above, you can see a typical accumulative swing index used for intraday trading. The indicator is bound between positive and negative values above and below 0.
Like in the graph above, traders tend to incorporate signal lines made of moving averages in the ASI. When the ASI below the moving average signal line, it is a signal for selling. When the ASI crosses the moving average signal line from above, it is a signal for buying for traders.
Signal line = Exponential Moving Average of the Accumulative Swing Index
The signal line uses an exponential moving average of the ASI values, which means that it uses a weighted index to develop the line. More weight is given to newer and more recent prices in the signal line.
How to Use it?
The accumulative swing index ranges from 100 to -100. The index is a momentum oscillator, which means that it is an indicator that oscillates between two extreme values that are bound between the values of high and low. It uses the range of 0 to 100 for uptrends and 0 to -100 for downtrends. When there is sideways movement in the market, the ASI alternates between the positive and negative values constantly:
- An upside breakout occurs when the value of the ASI exceeds the previous levels of high. An upside breakout from a high swing point generates a buying signal.
- A downside breakout occurs when the value of the ASI exceeds the previous levels of low. A downside breakout from a low swing point generates a selling signal.
Although the ASI is drawn alongside a candlesticks chart as an overlay indicator, it gives more accurate results than a regular candlesticks chart. The ASI charts are smoother and easier to use for traders. It is also more convenient to steer clear off of false breakouts using the accumulative swing index. During a false breakout, the trendline is exceeded from above or below in the price chart but the value of the ASI remains intact.
The distance of the ASI reveals an increase in momentum. The farther the ASI is from 0, the more strength a trend has. To check for the strength of trends using the ASI, the rule of thumb is that:
- During a long-term trend, the value of the ASI remains positive.
- During a short-term trend, the value of the ASI remains negative.
The accumulative swing index majorly incorporates the closing price to develop breakout levels. This prevents the indicator from relying too heavily on the daily fluctuations of opening and closing prices.
Extreme values of the indicator can also be used to generate overbought or oversold signals. This helps traders understand when a security is overvalued or undervalued. Such signals are important to observe as prices tend to go into trend reversals after overbought or oversold conditions. Traders can make use of the rising trend to ride market highs or lows efficiently.
Final Thoughts
While the accumulative swing index is a great device to develop the long-term trend for an asset, however, it can also be employed to generate short-term swing behavior. It develops a comprehensive overview of the pricing action by using a combination of different prices for the asset. You can use the indicator for proper market analysis and one-up your regular price bars or candlestick charts. The ASI prevents you from being deceived by any false breakouts. As it is with any indicator, it is imperative for traders to reference multiple sources and a variety of indicators to understand the market situation completely.

