The key to being successful in trading is all about maximizing your profits while minimizing risks and the ATR helps you to achieve that.
What is the ATR Indicator?
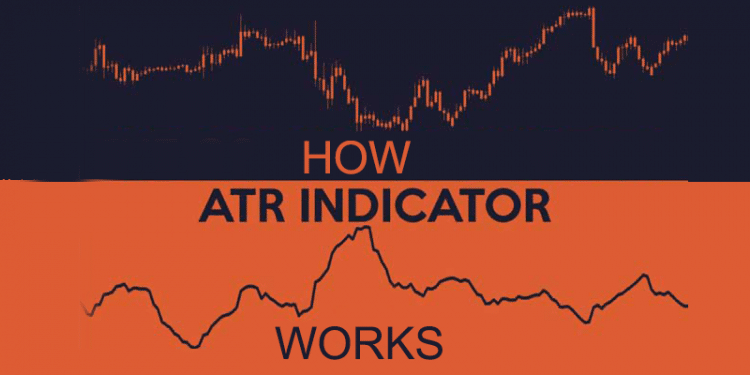
ATR stands for Average True Range. It is a technical analysis indicator that traders use to measure asset volatility. You can do it by decomposing the entire range of the price for the period you want to measure. The true range indicator is the greatest among the current high less the current low, the absolute value of the current low less the previous close, and the absolute value of the current high less the previous close.
You can derive the average typically from the 14-day moving average of the series of true range indicators. The indicator was developed to use in the commodities market originally. However, traders apply them now to trade all kinds of assets. You can calculate ATR by finding a series of true range values of security. For any given trading day, the price range of an asset is the subtraction of its low from its high.

History of ATR Indicator
Market technician J. Welles Wilder Jr. introduced ATR as a measure of volatility in his book “New Concepts in Technical Trading Systems” in 1978. The book also featured several other classic indicators like the Relative Strength Index, the Parabolic SAR, and the Average Directional Index. Like the other indicators mentioned in the book, ATR is a widely used and holds great importance in the world of trading when it comes to technical analysis. It is a great chart analysis tool that you can use to keep an eye on volatility that is an important variable in charting and investing. When you are trying to measure the overall strength of a move or discover a trading range, you can opt for it. The indicator is ideal to use as a complement to indicators that are more price direction driven. Once a move begins, the ATR applies a level of confidence to that move which is beneficial for the traders.
How ATR Indicator Can Be Adjusted
The ATR indicator is a very important indicator. Understanding asset volatility level can help a lot in growing your profits and decreasing your losses. However, there is a misconception about the ATR among traders. Most traders make the mistake to believe that a higher ATR value refers to a bullish trend and a lower ATR value refers to a bearish trend. The truth is simple: the ATR indicator does not indicate anything about the trend direction. However, you can use the MACD trend following strategy with ATR indicator to determine the trend direction as it is one of the best average true range forex strategies.
With the average true range forex strategies, you can look at the general ATR value which is related to the trend direction and it helps in determining the market trend. If you view charts where the ATR indicator is used, then you can see how the ATR volatility changes during the trend’s different stages. During uptrends, the ATR indicator posts lower volatility. On the contrary, during downtrends, the indicator posts higher volatility.
Now, you need to know that the fear factor provides the reason behind the ATR volatility phenomenon. It means that the market goes up slowly but falls back fast. The market has been functioning like this for centuries. An unconventional way to do technical analysis using the ATR indicator is applying the 20-day moving average over the indicator. You can use many platforms for this.
After attaching the ATR indicator to the trading platform, you can move the mouse cursor over the ATR indicator window. After that, you may right-click on the window and choose “Apply Indicator on ATR”. Then, another pop-up window will open up. From this window, you can select a moving average that uses a 20 period.

Basic strategies using ATR Indicator
Breakouts: when it comes to trading financial assets, breakouts are some of the best trading opportunities. When the price consolidates, the ATR prints low values for denoting a low volatility market. Breakouts occur with high volatility and they always follow periods of price consolidation. With the help of the ATR, traders can time these breakouts efficiently which give them the opportunity to join new trends from the earliest beginnings. After a period of flat or low values, you can notice a surge in the ATR that indicates higher volatility in the market. Then, traders can plan their trades and resulting breakouts accordingly.
Position sizing:
While trading financial assets, position sizing is important for risk management. If you apply appropriate lot sizes on various financial assets, then it can help you to minimize risk exposure. At the same time, it enhances your trading effectiveness significantly in the market. As a rule of thumb, you should trade high volatility markets with smaller lot sizes. Similarly, low volatility markets should be traded with bigger lot sizes. Assets like Bitcoin and gold have higher ATR values. So, you can trade these with smaller lot sizes. However, assets like the EURCHF pair print lower than ATR values. So, you can trade these with larger lot sizes.
Using a signal line:
The ATR is a volatility measure. It does not provide optimal entry points in a market. Traders can overlay a moving average on the ATR to remedy this. The moving average acts as a single line. For example, you can add a 20-period SMA (simple moving average) over the ATR and look out for crosses. When price trends higher, the ATR cross above the signal line confirms an uptrend. At that time, you can place aggressive buy orders in the market. Similarly, when prices drift lower, a downtrend is confirmed by the ATR cross below the signal line. This is the time to place aggressive sell orders in the market.
ATR indicator combinations:
As mentioned earlier, the ATR measures one price element and that is volatility. It means that you need to combine it with other indicators so you can identify more qualified trading opportunities within the market. You can go with:
- ATR and Stochastics: When it comes to trade ranging markets, Stochastics are perfect because they provide oversold and overbought signals. The ATR helps to qualify ranging markets and at the same time, it helps to avoid whipsaw signals. Stochastics generates these signals in non-ranging markets. Low ATR values confirm ranging markets and Stochastics crossovers provide buy and sell signals in oversold and overbought zones.
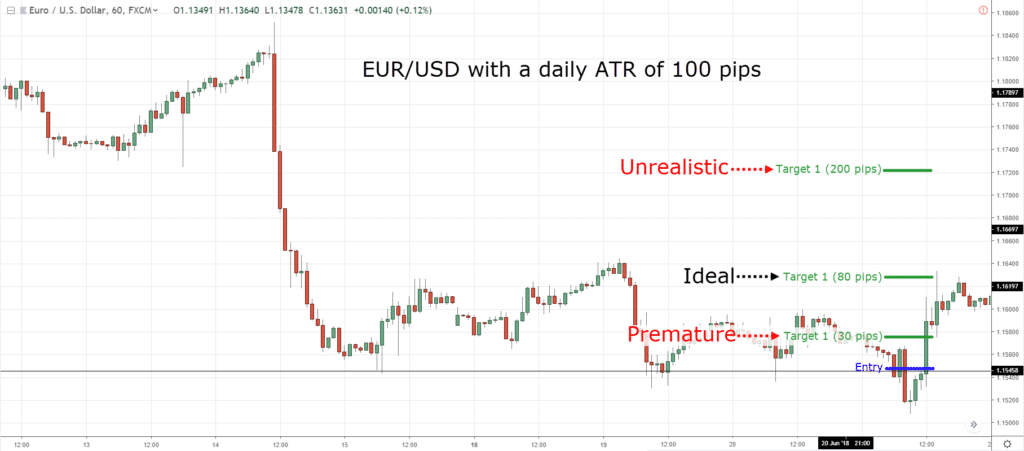
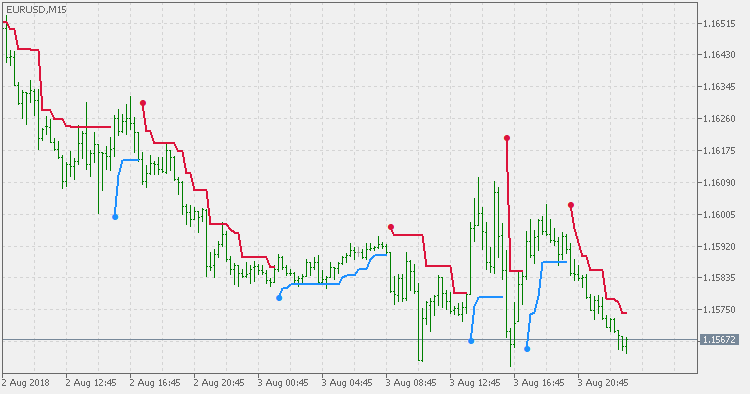
- ATR and Parabolic SAR: If you are trading trending markets, then you should opt for Parabolic SAR. By combining it with the ATR, traders can set definitive stop loss and take profit price points. By doing so, you can take full advantage of the trending market with minimal risk exposure.

The bottom line
If you want to try an unorthodox approach to trading, then the strategies using the Average True Range Indicator are a great option. The ATR combines both the price action and market volatility and provides us with the best trades possible. With this indicator, you can forecast the market with high-level accuracy. Learn about the strategies well before applying them and do not forget to test your strategies if you want to avoid losing your capital.


