The value of ADX swings between 0 and 100, and you can determine how strong a trend is by monitoring this value. When the value is below 20, it indicates that the trend is weak, and when it exceeds 50, it is an indication of a strong trend. Thus, while a rising ADX indicates a strengthening trend, a declining ADX tells you that the trend is weakening.
Prior to deciding whether to buy or sell, you should stand by for the breakouts to occur. With the help of the ADX indicator, you can tell whether the existing trend could persist for a particular pair. Alternatively, you can use the ADX in combination with another technical indicator that determines the direction of the trend.
The ADX also tells you when you ought to exit a trade early. When the indicator value starts sliding beneath 50, for example, it is an indication of the trend weakening. From that point, the pair may exhibit sideways movement, so it is wise to lock your pips beforehand.
The ADX indicator should be used when you suspect a trend is about to change. It will help you judge whether you should continue riding the trend or make an exit by assessing how strong the trend is.
Directional Movement Index
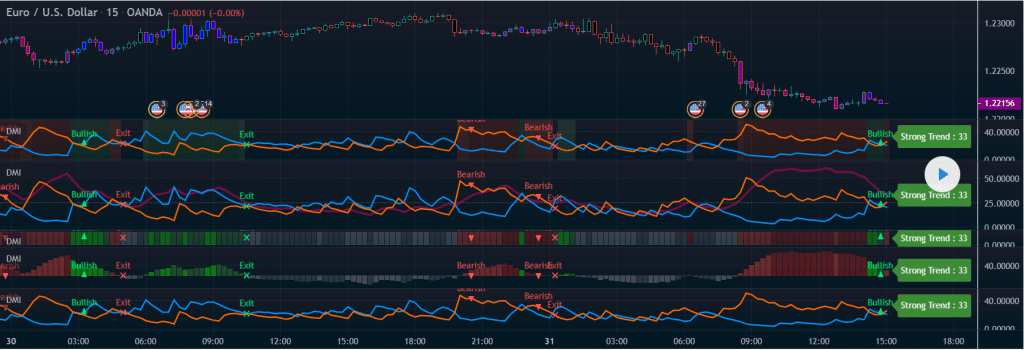
This trading strategy involves the Positive Directional Indicator (+DI), Negative Directional Indicator (-DI), and the Average Directional Index. When the value of the ADX is more than 25, you know that the trend is strong, and if the +DI creeps above –DI afterward, it’s an indicator of an upwards trend. Conversely, when the Negative Directional Indicator lies above the Positive Directional Indicator, a downtrend alert is triggered.
Remember, the uptrend or downtrend crossover alert will get triggered only when the ADX value is more than 25 while the crossover occurs. Afterward, if the ADX reaches 25 and –DI still lies below +DI, or +DI lies beneath –DI, the delayed alert will not get triggered.
If the value of the ADX is below 20, it is an indication of a weak trend, and when the reading lies between 25 and 20, it is not possible to determine how strong the trend is. For the uptrending DI Cross, you should place the stop loss at the present day’s trough, while a trailing stop should be placed if the signal rises.
For a downtrending DI Cross, the stop loss ought to be placed at the present day’s peak, and the trailing stop should be placed if the Average Directional Index grows strong.
Stochastic and ADX
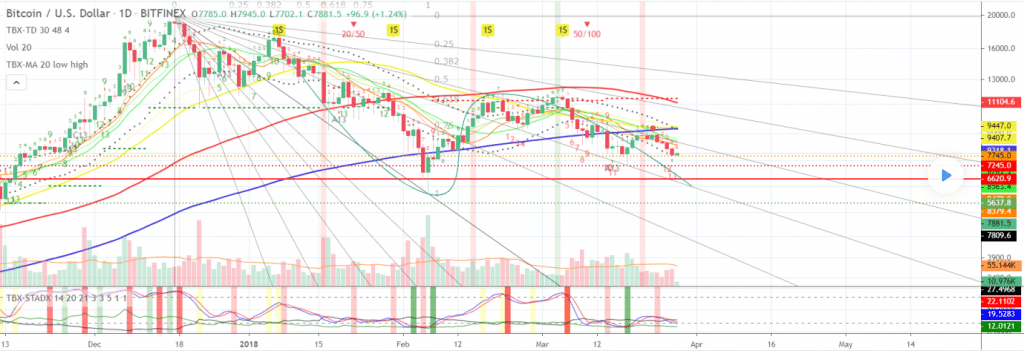
In this strategy, you determine the strength of the trend using the ADX indicator, while the Stochastic indicator tells you about the momentum. You can use this on a currency pair for a time frame of 5 minutes or more.
For a buy trade, you need to check the following:
- Whether the ADX(14) is more than 20
- If 15 EMA exceeds 30 EMA
- If 5 EMA is more than 15 EMA
- Whether Stochastic (5, 3, 3) is more than 50
If you notice a bullish trend, you should re-enter when the Stochastic crosses above the 50 levels again from below.
The conditions for short entry are as follows:
- The ADX(14) must be more than 20
- 15 EMA must exceed 30 EMA
- 5 EMA is more than 15 EMA
- Stochastic (5, 3, 3) is less than 50
If the trend is bearish, you should re-enter when the Stochastic line crosses down the 50 levels again from below. The stop loss should be kept at ten pips with added spreads.
EMA MACD ADX
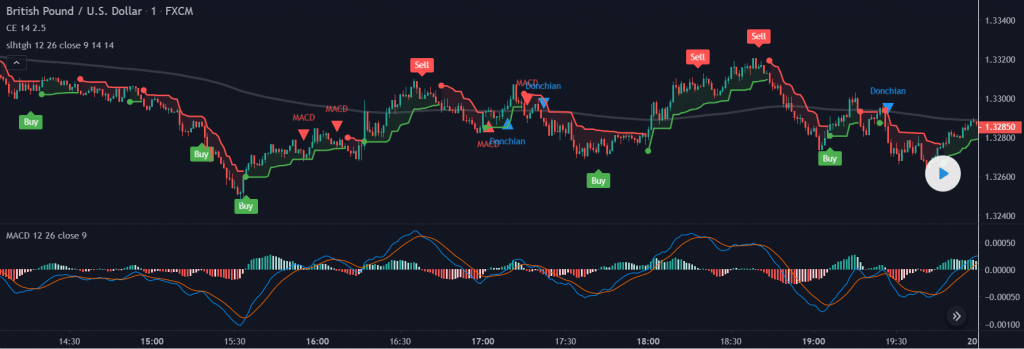
Here the Donchian channel and MACD indicators are filtered using ADX>25 and EMA 200 in order to display the trend. You should make a long entry when there is a bullish trend, and the MACD line intersects the signal line and moves upward. Both the MACD line and the signal line must remain beneath the histogram’s zero level, and the price must be more than ADX>25 and EMA 200 both.
You should sell the pair when there is a bearish trend, i.e., the price lies beneath both ADX>25 and EMA 200. At the same time, the MACD line must intersect the signal line and move downwards while being above the histogram’s zero level.
ADX and MACD
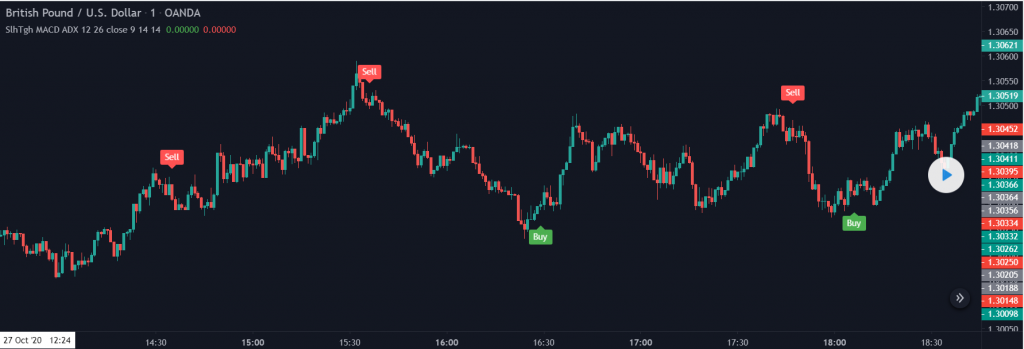
This strategy is best suited for a timeframe of 15 minutes or more. The ADX setting should be taken as 14, while the MACD setting should be 12, 26, 9. You should place the stop loss over or below the high or low of the nearest swing.
A buy trade should be placed when MACD is more than 0, the D+ line exceeds the D- line, and when the value of the ADX is more than 20 and rising further. Conversely, a sell trade ought to be placed when MACD lies beneath zero, D- line is more than D+ line, and when the ADX line lies above 20 and continues to rise upwards.
Adaptive ATR-ADX
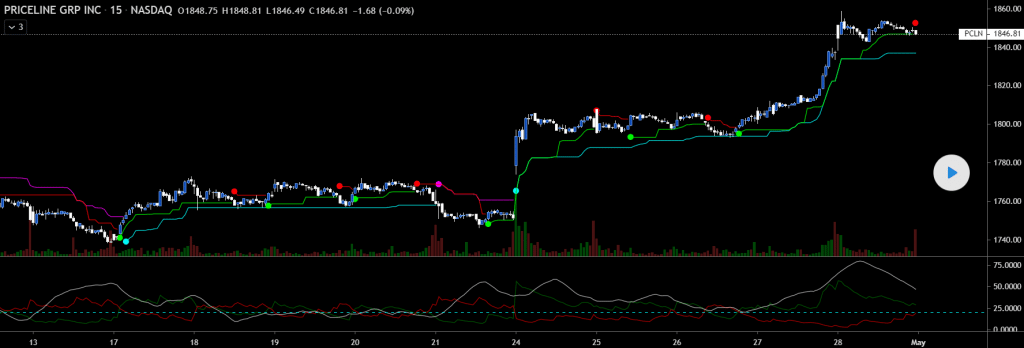
Here the trailing ATR stop is placed below or above the price, and the direction is switched when the ATR stop is broken by the source price. The ADX can be used for switching between AR multipliers. When the ADX rises, you use the higher multiplier, and when it falls you use the lower one. In the trending market, the gap between the trailing ATR stop and the source price becomes wider, and when it is not trending, this gap narrows down.
Summing up
The similarities between the chart situations are as follows:
- They tell you whether a new trend is about to begin or whether it’s a ranging market.
- You can decide whether you should ride a trend or not by studying it.
- They tell you how long the trend will last.


