Swing trading is a trading style that focuses on short- to medium-term market changes to make a profit. Market swings can occur over a few days or even months; thus, the goal is to take advantage of these fluctuations. Trending markets lend themselves well to swing trading strategies.
For traders, there are two swings they keep an eye on:
- Swing highs: It’s possible to profit when you short the market at swing highs, which occur when the market hits a high before falling back.
- Swing lows: This is a good opportunity for a long trade whenever the market declines and then comes back.
How does swing trading work?
From a few days or even as long as several weeks, swing traders have several options they can employ to leverage crypto price fluctuations. They employ technical analysis tools and market fundamentals over time to develop trading strategies.
To conduct technical analysis, one must look at the past market data of an asset. This data contains the price and volume of a cryptocurrency. Traders and investors can make better predictions about future market behavior by looking at historical trends and patterns.
When performing fundamental analysis on an asset, analysts look at both qualitative and quantitative criteria, such as its market capitalization and other economic indicators, to determine its “fair market” worth or true value. In contrast to technical analysis, the fundamental analysis assesses whether an asset’s price is inflated or undervalued.
Many traders, if not the vast majority, don’t stick to just one method of trading when managing their portfolios. They often mix these two to search for profitable trading opportunities. By doing so, they can take advantage of significant price swings and avoid downtime.
Using technical analysis for swing trading
The goal of employing technical indicators is to assist traders in making more logical investing decisions. These tools, which are based on mathematical formulas, provide traders with a more critical perspective on an asset’s price and trading volume.
It is common for traders to compare the value of a cryptocurrency in the leadup to or following a significant announcement, then evaluate the price and demand before making an investment.
Below are some of the most commonly used indicators.
Relative Strength Index (RSI)
This RSI measures the strength of a price trend and the likelihood that it may change. A trader can see when the value of a coin is at its highest and lowest points by analyzing the relationship between its price and demand.

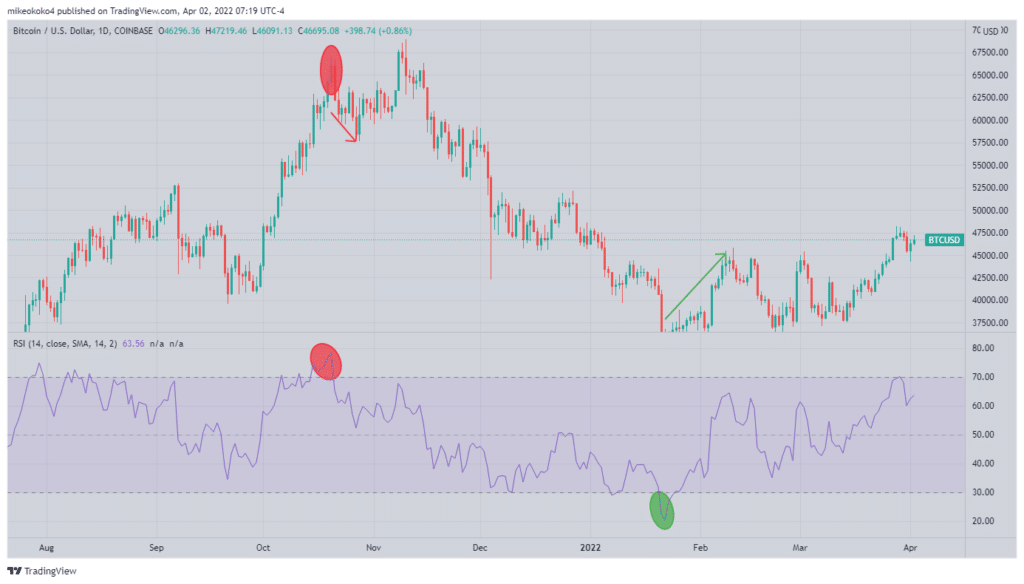
On the chart above, when the RSI line passes 70, the market is indicating overbought conditions, as shown by the red highlight (a sell signal). This is a buy indication when it goes under 30 (green highlight). These RSI lines, nonetheless, are not fixed and might alter depending on the preferences of the trader.
Profitable trading strategies include buying when prices are oversold and selling when prices are overbought.
Moving Averages (MA)
Short-term price changes provide a good opportunity to use MAs for swing trading. By averaging the price of an item over a certain time period, MAs help to smooth out short-term volatility, which can be confusing to rookie traders.
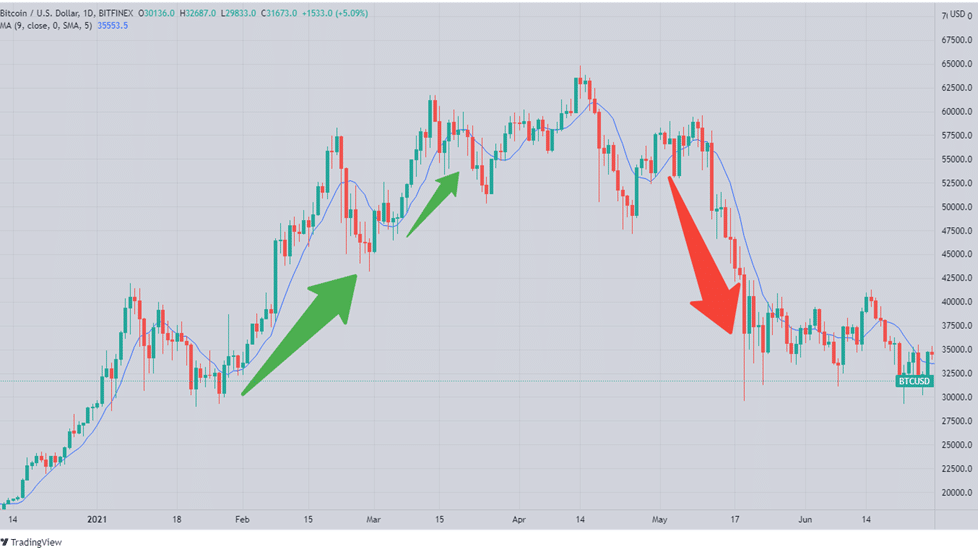
An investor could use an MA indicator, for example, to determine whether the market is trending. The trader goes long as soon as the coin crosses the Moving Average. With this breakout comes an increase in the number of people who want to buy. After this breakout, there is another rush of buyers. The coin’s value rises as a result of this upsurge. This sudden increase in price is good news for the investor.

On the chart above, we see how the MA line acts as a support level during an uptrend and becomes the resistance level during a downtrend.
Bollinger Bands (BB)
Bollinger Bands have been debated as the only indicator a swing trader needs. An effective swing trading method relies on the use of Bollinger bands to identify price rollbacks.

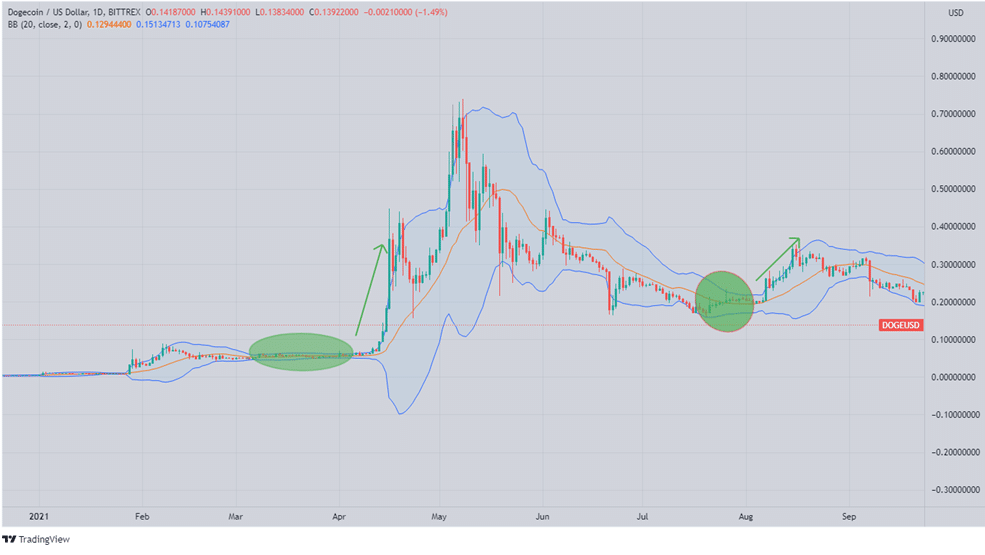
The usual range of prices is defined by BBs in most circumstances. Moving Averages are plotted in a central band, with the upper and lower bands representing the middle band’s standard deviations.
Swing traders should be aware of the entry and exit signals that come from BB. For instance, when the price moves outside of the upper Bollinger band. On the chart above, the DOGEUSD breakout happens when the BB becomes narrower.
Buy the pullback
For investors who missed the original breakout moment, this swing trading crypto technique is ideal. Missing the breakout doesn’t mean the game is over.
A common investment strategy is known as “buying the pullback” instead of “buying the runup.” After a breakout, a coin’s price often rises. Traders, on the other hand, will eventually start taking profits. This results in a significant drop in the price of the asset. If you missed the first breakout, this sharp reversal provides a second opportunity to get in on the action.
Pullbacks are an indication that the market’s main trend has temporarily slowed down. This may be due to a temporary drop in investor confidence following recent economic statements.
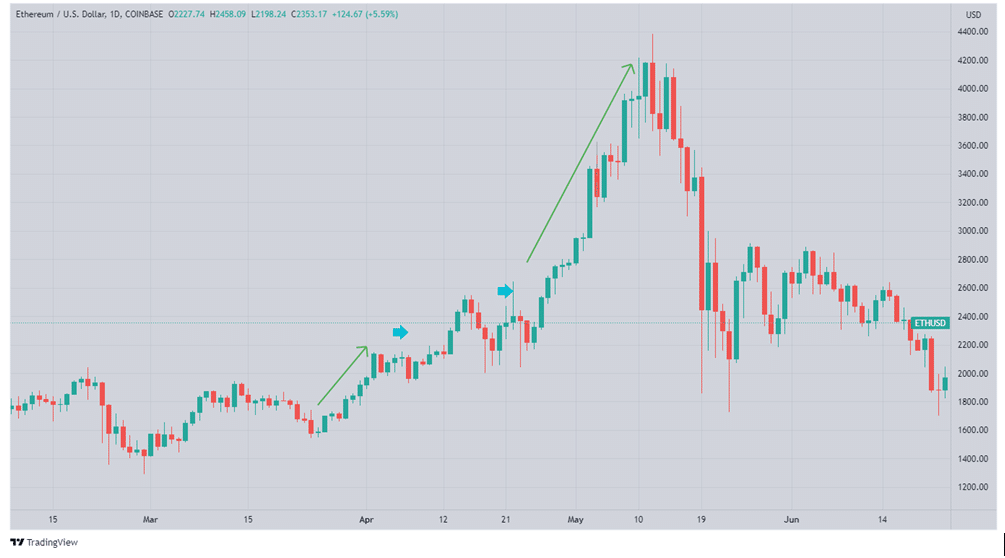
ETHUSD is an uptrend in the chart below, but we notice the pullbacks in the areas indicated by the blue arrows. Each time, the uptrend continues after the pullback.

Thus, pullbacks are considered a good time to acquire a rising asset. As a precaution against the reversal, traders should be mindful not to buy into the pullback too early unless they have a risk management plan.
Moving Averages, Pivot Points, and other indicators can assist you in identifying if a pullback is, in fact, a reversal of the trend. This is because these indicators reflect different levels of support. A reversal is expected if the downturn breaks through this support level.
In summary
The swing trading approach is a viable strategy for trading assets such as crypto. A cryptocurrency’s price can go up and down dramatically because of market speculation. When it comes to predicting the future direction of a particular coin, conventional analysis typically falls short. However, it appears that evaluating and forecasting short-term patterns works better in the long run.


