Forex traders can profit from the huge price volatility and low spreads of the EURUSD, which is the most liquid currency pair in the market. As the most popular instrument in the forex market, it presents numerous trading opportunities.
Even so, it’s important to know how to trade the EURUSD best Traders who want to make the most money in the market should become well-versed in all aspects of the business. They must learn about the currency pair’s trends and how to use this information to trade the pair.
The RSI approach may be used to trade the EURUSD pair, and this article explains how to do so.
How the RSI works
The RSI indicator is not plotted directly on the price chart but rather in a separate window under the main section. By default, the instrument has a single line and two preset levels.
It is common practice to use the 70 and 30 level as conventional thresholds to indicate overbought/oversold marks. If the indicator’s line crosses the 70 threshold, it indicates that the market is overbought and that the trend is likely to change direction to a downtrend.
Whenever the reading falls below the threshold of 30, it indicates that the market has become oversold and that the trend may be reversing to the upside. The median number is 50, which serves as the baseline.
There is a low probability of a short-term reversal if the indicator chart is between the levels 30 and 70. Nonetheless, 80 and 20 sometimes serve as substitutes for 70 and 30, respectively. During times of high market volatility, this setting is activated.
Failure swings
A “failure swing” occurs when the RSI crosses over the ‘overbought’ / ‘oversold’ line before reversing to the other side and pulling back without crossing over the line again. When the RSI breaches the recent price lows or goes above the most recent high price before resuming movement along its previous trajectory, we know that the swing has effectively come to an end.
There are two types of failure swings: those at the top (RSI reading 70) and those at the bottom (RSI reading 30). Both are reversal signals, with the former signaling a buying opportunity and the latter signaling a selling opportunity. Failure swings cause RSI trend lines to break as well.
Strategies for trading RSI
Buying and selling pullback
An important part of the pullback method is using counter-trend movement as a guide to identifying significant support and resistance levels. The identification of these levels helps to determine whether the price swing is coming to an end and the previous trend is resuming. It is typical to see these levels at previous highs and lows.
You can use the 45 and 55 point thresholds on the RSI to identify buying and selling opportunities in EURUSD using the pullback approach. As a result, when the RSI line drops below 45 from the previous high, you can buy a few pips above the top of the first up candle. Sell just a few pips below the trough of the first down candle that is formed when the RSI line rises above 55 from below.
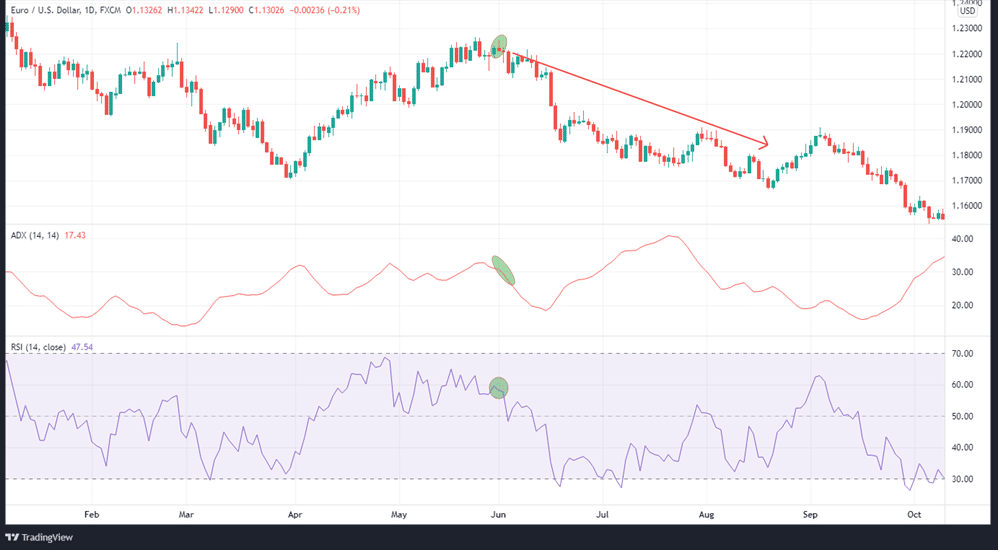
ADX readings above 25 and +DI values higher than zero are required to validate this signal’s validity. Short RSI signals are only valid when the ADX is above 25, and -DI is above +DI, as shown in the following chart.

The stop is located above the signaling candle’s high. Exit the trade by looking for price action indicators on the chart, particularly a breakout in the direction that is opposite of trendlines.
Breakout trading
When the resistance levels are broken, low-risk trades have the potential to make money.
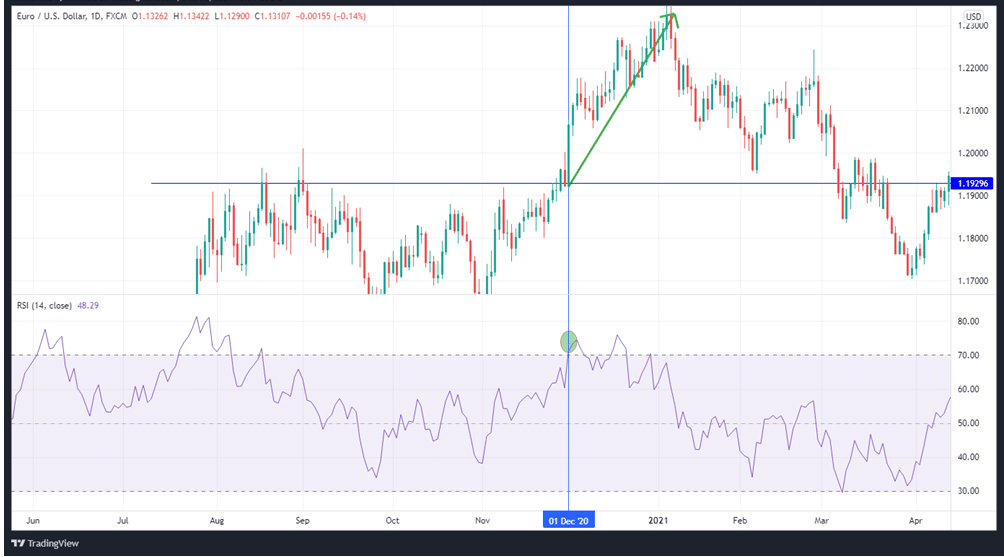
A breakout of a critical resistance will be confirmed when the RSI crosses into the overbought zone at a value of 70. According to this theory, RSI should rise in tandem with market momentum. If the price is falling and breaking through a level of support, the same holds true. In order for traders to confirm the movement, they can wait for RSI to fall below the 30 level.
The breakout on the EURUSD can be seen in the chart below. At that point, the pair’s current resistance level was 1.19296. The RSI is signaling the overbought condition at the same time.

Bullish momentum is gaining steam, and breakout traders may see this as a sign that further breakout positions should be taken.
Overbought/oversold levels
The default parameters for the RSI signal levels are 70 and 30, corresponding to overbought and oversold conditions, respectively. A shift in trend direction or deep correction could be signaled by a change in the indicator line’s direction in this case. However, as discussed below, in instances of divergences, the trend may travel in the opposite direction.
When the lines return to the range, look for entry points:
- Early signal: When the oscillator is in the oversold zone, it rises, and when it is in the overbought zone, it falls.
- Primary signal: Sell when the oscillator reaches a high of 70 from the bottom up. Enter a buy trade if it breaches level 30 from the bottom upwards.
Divergences
Lagging can cause significant differences in the trajectories of price and the RSI. Because the Relative Strength Index is a forward-looking indicator, the price tends to follow. We get divergences when the price chart shows a continuation of the trend, but the signal line has gone in the opposite direction. In this case, divergence indicates imminent trend change.
RSI divergence types:
- Bullish: Indicator and price lows are both getting lower.
- Bearish: While the price is rising, the indication is falling.
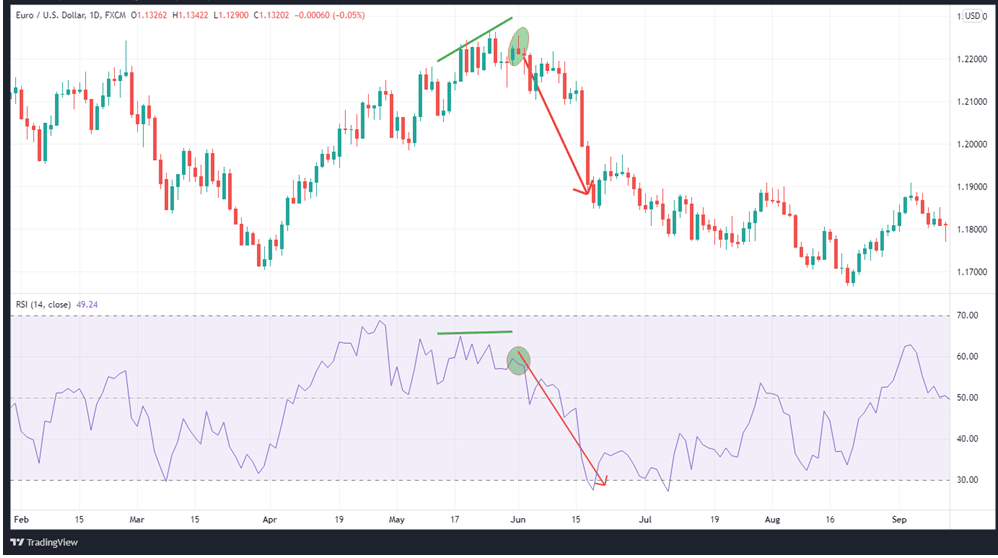
We can see divergence on this chart:

Indicator line divergence happens while the indicator line is in either the overbought/oversold zone, and the signal is at its strongest during this period. When at least one of the low or high divergence levels is above 70 or below level 30, it indicates a weaker but still significant movement.

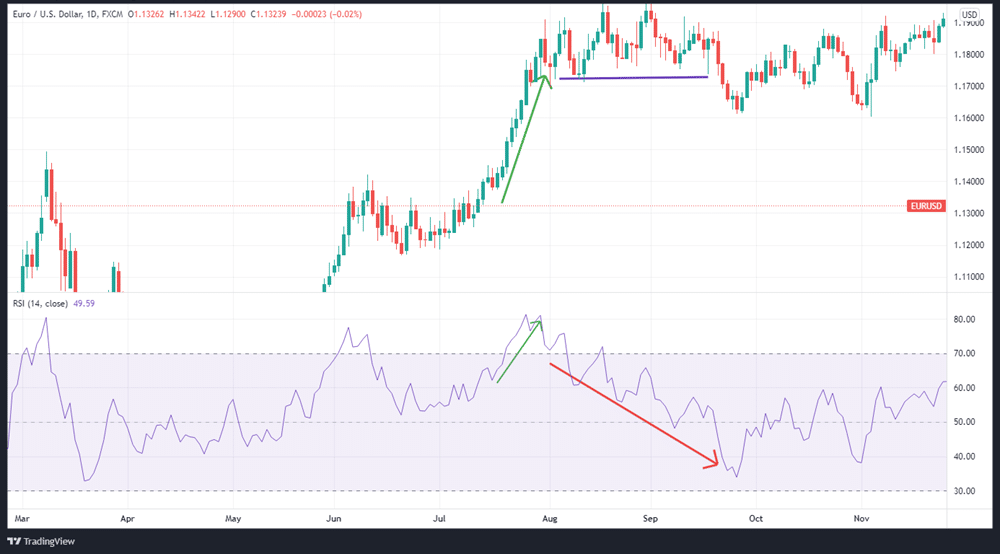
We can see an example of bullish divergence on the chart above. The price is initially in an uptrend as the RSI also rises. However, the price then heads sideways as the RSI heads downward, indicating a potential reversal. You get an excellent chance to make a profit when you get into the market as the price trajectory and RSI head in the same direction.
In summary
RSI is a tool that shows the strength of a trend and the likelihood that it will reverse, with the direction depending on whether it is overbought/oversold. It is an instrument for gauging how quickly prices fluctuate. The closer the RSI line gets to the extremes of 100 or 0, the stronger the market movement.


