Trading cryptocurrencies and the forex market requires patience and talent to identify high-risk-reward opportunities. While technical analysis allows people to gain an edge in price prediction, the same should not be complicated by using dozens of indicators.
Understanding Exponential Moving Average (EMA)
Exponential Moving Average (EMA) is one of the oldest and most commonly used tools in the technical analysis of crypto and currency pairs. It stands out given its edge in ascertaining the prevailing trend. It is also used to pinpoint support and resistance levels in price action analysis.
The indicator’s edge stands out partly because it pays attention to the most recent price data to predict how the market is likely to move. In contrast, the Simple Moving Average does not pay emphasis to recent prices.
Therefore, the EMA tends to respond much faster to price dynamics allowing people to predict the trend accurately and the direction in which the market is likely to move timely.
Uses of EMA
The Exponential Moving Average serves the key roles below.
A long-term EMA such as 200-day provides insights into the underlying trend. If the price is above the EMA, it signals the market is trending up and that prices of security under analysis are likely to continue increasing. Likewise, if the price is below the indicator, it signals a downtrend, implying asset prices are likely to continue tanking.
The use of two EMA allows traders to make use of crossovers to ascertain entry and exit points while trading cryptos and currency pairs.
Finally, EMA’s are commonly used to identify strong support or resistance points on the prevailing price action of assets under study.
Top EMA strategies
Strategy 1: the buy crossover strategy
As a trend following indicator, EMA’s quick response to price changes makes it an ideal tool for identifying the points to trigger long positions. Whenever price oscillates above a fast or slow EMA, the bullish bias is considered in play, and traders use this opportunity to explore long positions.
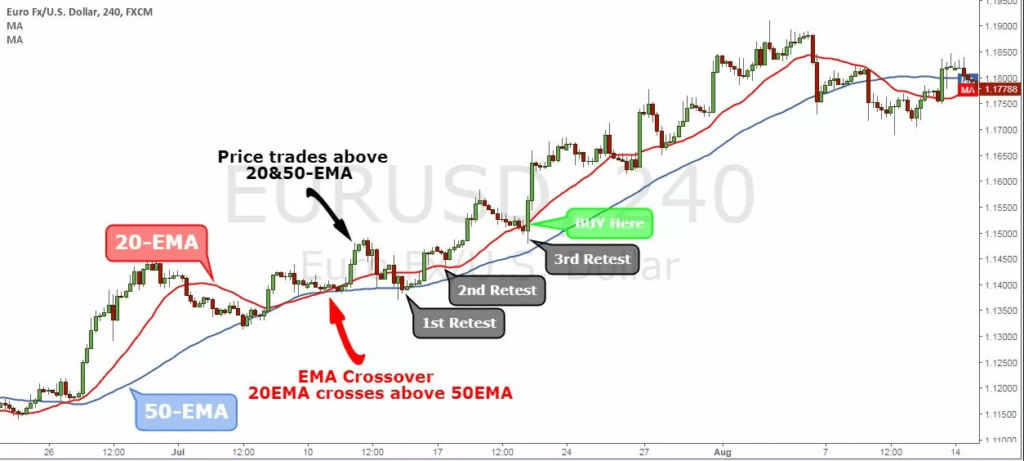
In our case, we will use 20 EMA and 50 EMA to generate a buy signal with this strategy. With this strategy, an early sign that it is time to eye long or buy positions occurs whenever the price moves and closes above the fast-moving 20EMA.

Whenever the 20 EMA moves from below and crosses the 50 EMA and continues moving up, it implies bulls are in control, and market sentiment has turned bullish. Similarly, a trader can look to trigger buy positions as soon as the price closes above the 50 EMA.
In the chart above, a buy position could have been triggered as soon as the 20 EMA crossed the 50 EMA and price closed above the two Exponential Moving Averages. For traders who like to be extremely cautious, the ideal entry would have been when the price started moving lower after the crossover only to bounce off the two EMA’s.
Any pullback to the 20 or the 50 EMA followed by a big bullish candlestick signals bulls are in control, and that price is likely to continue re-rating higher.
Strategy 2: the sell EMA crossover strategy
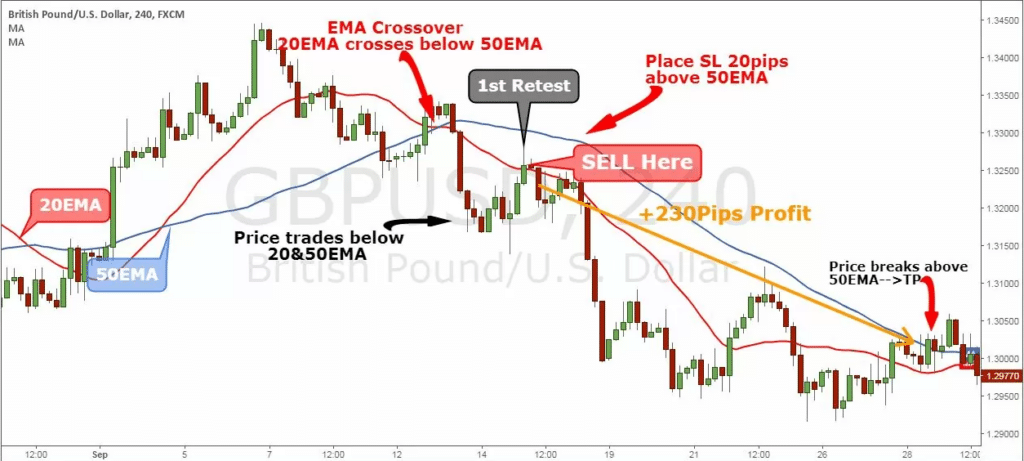
The strategy is similar to the buy EMA strategy, but the focus, in this case, is on markets trending lower. A downtrend is only confirmed when the price moves and closes below the 20 EMA and 50 EMA. The crossover signals that bears are winning the fight against bulls and that price is likely to continue edging lower conversely, making lower lows.
A crossover characterized by the 20 EMA crossing the 50 EMA and moving lower only goes to affirm a buildup in selling pressure. This would be the perfect time to look for ideal entry points. Consequently, the entry point would be when the price bounces back after moving lower only to get rejected near the 20 EMA, as shown in the chart below.

The “1st Retest” acts as an ideal entry point for a sell position, given that the crossover indicates strong short-selling pressure in play despite the bounce back.
As long as the price is below the two EMAs, any bounce back to the slow or fast-Moving Average provides an opportunity to enter a short position to ride the prevailing bearish pressure in the market.
EMA-RSI strategy
No indicator should ever be used in isolation to make trading decisions. Therefore, for the best outcomes in crypto and forex trading, it is important to use the EMA in combination with another momentum indicator, such as the Relative Strength Index (RSI).
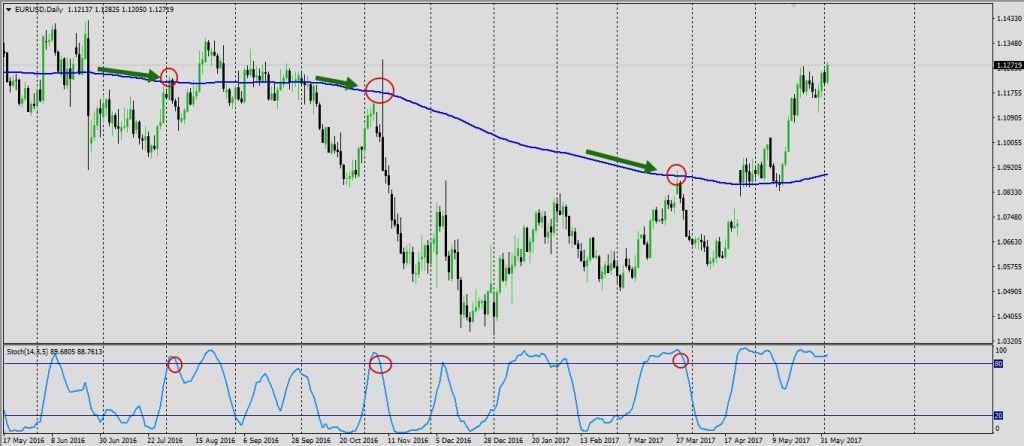
The RSI stands out as it signals prevailing market conditions: overbought or oversold. Therefore, it can be combined with the EMA to identify ideal entry points. Whenever the RSI reading is above 80, it implies overbought market conditions. While security can remain in overbought conditions for a very long time, the prospect of a potential reversal is usually high.

The chart above shows that the market is in a downtrend characterized by the price being below the 200 EMA. Whenever the price bounced back after edging lower, it experienced strong resistance near the 200 EMA. The RSI reading above 80 only affirms that the market has entered the overbought territory, implying a potential reversal in the offing.
Traders who entered sell positions as soon as RSI reading was above 80 and price got rejected near the 200EMA ended up locking a significant amount of profits on a sell-off.

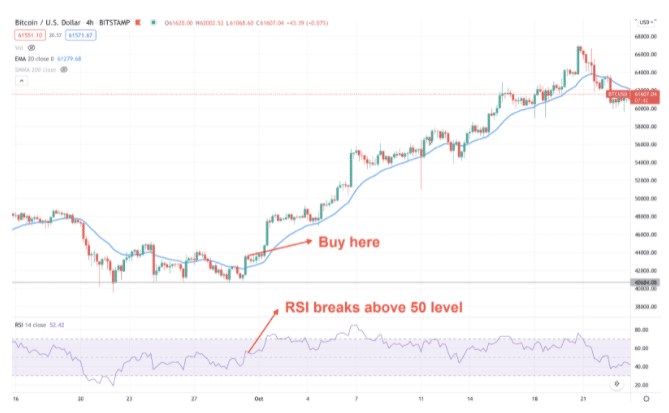
Similarly, whenever the RSI indicator crosses above the 50-line and price closes above a Moving Average, it always implies strong upward momentum. In this case, technical analysts use this opportunity to enter long positions on any pullbacks that follow afterward towards the EMA.
Final thoughts
The Exponential Moving Average is a directional indicator that provides valuable information on-trend and ideal entry and exit points. When used in combination with other tools such as the Relative Strength Index, EMAs provide more accurate results on the best risk-reward opportunities.


