The GBPUSD (or pound dollar) currency combination is part of the ‘Majors’ category, which refers to the world’s most important currency pairs. The pair is also known as ‘The Cable,’ after the first Trans-Atlantic cable that connected Great Britain and the United States of America across the Atlantic Ocean. It is the world’s third most traded forex pair, accounting for just under 10% of the worldwide foreign exchange volume. The pair’s popularity stems from the fact that it has a lot of liquidity and volatility. Furthermore, obtaining economic data on the two economies is quite simple, which aids investors in price speculation.
Background of UK economy
For over a century, the United Kingdom was the world’s most powerful nation. It was the world’s largest economy and the top player in international trade. The pound was the world’s reserve currency. However, following the First and Second World Wars, the United Kingdom entered a period of relative decline. During that time, the United States ascended to become the world’s economic superpower. Later, in the 1980s, the British economy regained its dynamism.
Background of US economy
The United States is the world’s most powerful economic power, accounting for over a quarter of global nominal GDP. The US economy is predominantly service-oriented, with real estate, transportation, financial services, other business services, and health care accounting for about 80% of GDP.
With a manufacturing output of 2,341.85 billion dollars in 2019, the country is the world’s second-largest manufacturer. Given the sheer scale of the US economy and its pillars of strength, the impact of economic data from those sectors on the US dollar, and thus the global Forex market, can be clearly understood.
Why should you trade the pair?
- The United States and the United Kingdom have some of the world’s oldest and greatest economies.
- The pair has a high level of volatility and liquidity, allowing forex traders to enter and exit the market quickly.
- The two countries’ economic indices make obtaining and making trading judgments easier than other countries.
- It’s good for day trading because of the tight bid-ask spreads.
Trading time strategy
During the UK and New York sessions, the GBPUSD experiences a spike in trading activity. The pair records the most data when these sessions overlap between noon and 4:00 pm GMT. You may expect the tightest spreads and the least slippage at this time. Alternatively, you might trade it at the start of the London session, at 7:00 a.m. GMT, when the pair sees a lot of activity.
The pair is suitable for both day and swing trading. This is due to the fact that its average daily range (ADR) is large enough for short-term traders to profit from price swings. Furthermore, the pair’s prices are generally moderately stable, except when major news events such as central bank monetary policy pronouncements trigger price spikes.
You can also trade based on the current news. As a result, economic news from the United States and the United Kingdom, such as unemployment rates and consumer market sentiment, cause a shift in the price range. There is a good potential of obtaining an advantage over competitors if one reacts before the other traders.
Fundamental analysis
- Monetary policy decisions
The BoE and the Fed’s decisions have a substantial impact on the pair. Hawkishness is described as one of the two central banks hinting at raising interest rates or tapering quantitative easing programs. These banks are deemed to be dovish when they hint at a more accommodating monetary policy. A hawkish Fed is good for the dollar, and a hawkish BoE is good for the pound.
- Economic reports
Every quarter, the GDP report is produced, and it measures a country’s overall output. GDP figures have the most impact on the value of a currency since they provide information about the state of the economy. A strong UK GDP is positive for the pound, whereas a high US GDP tends to boost the dollar.
Trade balance figures also have an impact. There is a trade surplus when exports surpass imports, which is bullish for a country’s currency. A trade deficit, on the other hand, causes the country’s currency to depreciate.
Jobless claims and non-farm payroll statistics are included in the unemployment figures. A high unemployment rate is negative for a country’s currency, whereas low unemployment increases its worth.
- Currency correlation
Correlation is a statistical measure of the relationship between two currency pairs. The higher the correlation coefficient, the closer they are aligned. A positive correlation indicates that the values of two pairs are moving in the same direction, whereas a negative correlation indicates that they are moving in opposite directions. The pair is positively correlated to GBPSGD, EURUSD, GBPJPY, and EURSGD and is negatively correlated to EURGBP.
Sample trading strategy
Breakouts
Price shift from a time of low volatility to a period of high volatility is referred to as a breakout from a narrow range. Forex traders are always on the lookout for such narrow ranges since they imply the possibility of a large shift. They’d bet on a possible breakout in the underlying trend’s direction.
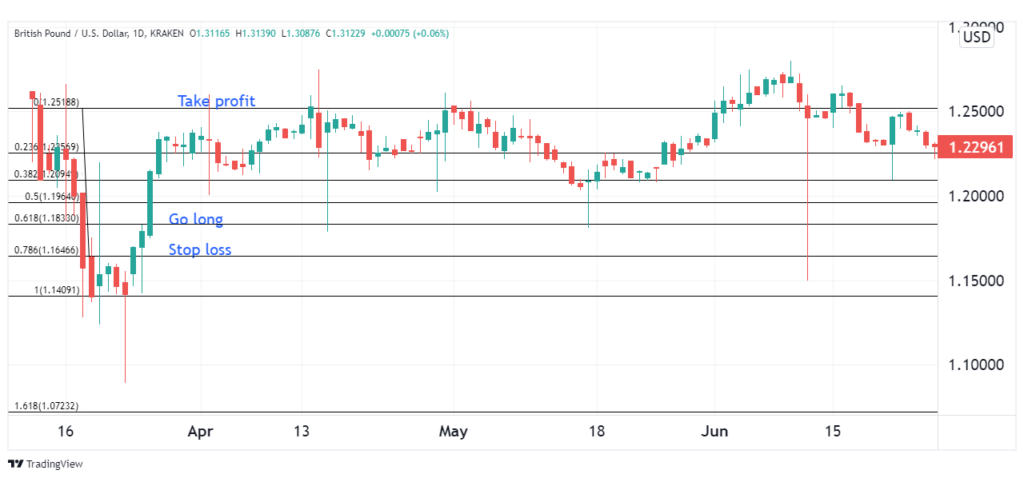
When looking for breakout possibilities, Fibonacci retracements are a popular tool to use. The Fibonacci technique finds hidden support and resistance levels that can be used by investors to place entry, exit, and stop orders.

There was a price breakout in the GBPUSD chart above, and it progressed in a bullish trend. Use the Fibonacci retracement tool to trade when the price starts to retrace. You can enter the trade at 0.618 Fib retracement level, place the stop loss at 0.7816 Fib retracement level and take profit at 1 Fib retracement level.
Summary
The GBPUSD is a target for most day traders. Aspiring investors will continue to be enticed by the narrow bid-ask spreads. Make sure you’re using volumes and trading at appropriate periods for the best odds of profit. Do in-depth fundamental analysis and concentrate on Fed, BoE, and economic indicators. You can use numerous strategies based on technical analysis, such as the breakout approach, and different indicators, such as the Stochastic and RSI.


