
Buying the dip in forex refers to the practice of going long after a currency pair has pulled back from an uptrend. It’s a proven strategy that works most of the time as no security ever moves endlessly in one direction. Rallies and pullbacks are common occurrences in the trillion-dollar marketplace that present unique opportunities to enter long and short positions.

Buying on the dip amounts to purchasing a currency pair at a low price or a discount, thus increasing the prospects of generating significant profit once it bounces back and starts moving up. However, it is important to note that a dip does not have a fixed value attached to it. Thus, it is difficult or impossible to know if a major currency has dropped significantly and is now due for a correction higher.
While some traders might consider a 20% dip enough to enter a long position, others often wait for a 50% or 61% drop to purchase on the dip. Amid the disparity, the further a currency pair dips, the more upside potential trade will present once a rally is underway.
Below are some of the best strategies for anyone looking to profit from dip-buying.
Fibonacci retracement strategy
Fibonacci is one of the best indicators for anyone looking to profit from retracements. The indicator stands out partly because it can pinpoint possible support and resistance levels whereby price could potentially reverse. The tool is especially useful in trending markets which also aligns perfectly with dip-buying.
With this strategy, the idea is to go long once the price has pulled significantly to a given support level in one of the retracement levels. The strategy works by first identifying a significant swing high and a significant swing low. Given that dip buying is all about buying after the price has corrected from a swing low, then the tool should be dragged from a swing low to a swing high, as shown below, to identify potential retracement levels.
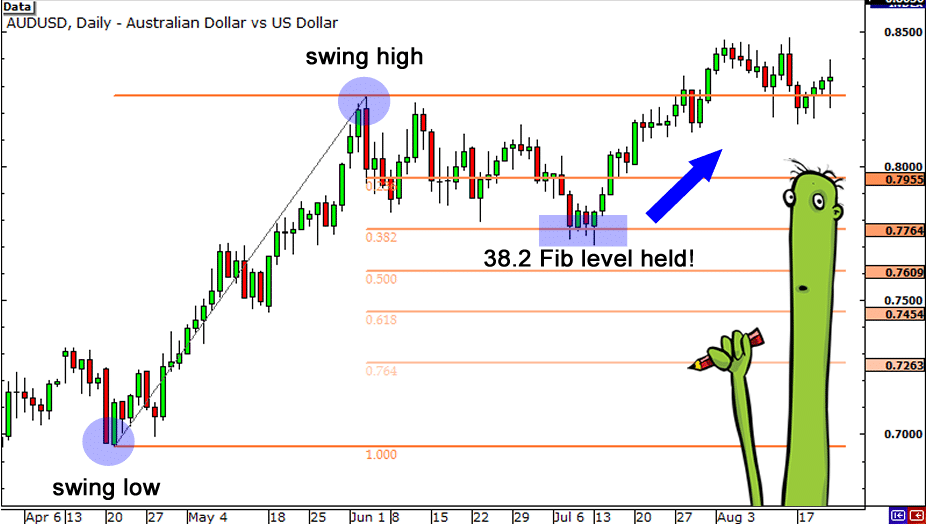
Here the Fibonacci tool is plotted from a swing low of about 0.6955 and dragged to a high of 0.8264. It’s clear that the price edged lower from the swing high of 0.8264 to the 38.2% Fibonacci level, signaling a 38% pull back from the current high.
Upon hitting the 38.2% level, buyers came into the fold and started buying the dip. The hammer candlestick formation confirmed that the downward pressure had lost momentum at the key support level and that price is poised to edge higher. From here, the price went higher, powering through the previous high.
While some people look to enter a long position on price correcting to the 38.2% level, others wait for a correction to the 50% level. A correction to the 61.8% offers the best opportunity to buy on the dip, given that the bounce back is usually big, resulting in price edging significantly higher.
Stochastic deep buying strategy
Stochastic is one of the best indicators for identifying points where a currency is oversold or overbought. Additionally, it can act as an ideal tool for identifying points to enter the long position after a deep pullback.
Once it is ascertained that a currency pair is in an uptrend, the concept of deep buying can be put to use. Major currency pairs move higher, after which periods of pullbacks or retracements occur. As price trends up, the stochastic indicator also moves up with the fast Moving Average in the indicator above the slow Moving Average. Additionally, the indicator will signal a currency is in an uptrend if its reading is above 50.
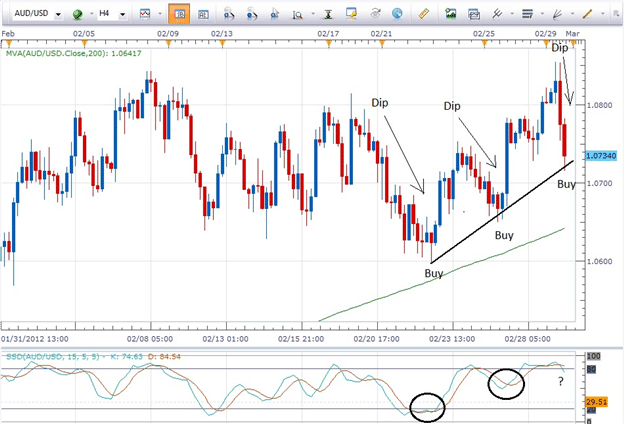
In the chart above, the AUDUSD pair pulled back significantly to a point where the stochastic indicator plunged below 20, signaling oversold conditions. Sensing a window of opportunity, buyers started piling pressure resulting in the fast (blue) Moving Average going above the slow (red) Moving Average, indicating a momentum shift to the upside.
With AUDUSD deep in oversold territory, but the underlying trend still bullish, traders entered long positions near the 1.0650, from where the price started edging higher. Upon price moving up significantly, the stochastic indicator once again signals overbought after moving above 80—price declines from this point.
An opportunity to buy the dip arises on the fast Moving Average growing above the slow Moving Average, signaling momentum shift to the upside, with the price edging higher.
Price action setup
Not all dips are worth buying. This is because the price can continue moving lower despite appearing to have dropped to a crucial support level. Ideal support, whereby price is likely to bounce back and continue moving up in the continuation of an underlying uptrend, is one where demand starts streaming back into the market.
When the price is moving lower as a pullback play, supply is usually higher than demand. However, demand starts to build up as price approaches a crucial support level, consequently triggering a bounce back in price. Japanese candlestick is crucial in identifying the broader demand and supply conditions while trading forex majors.
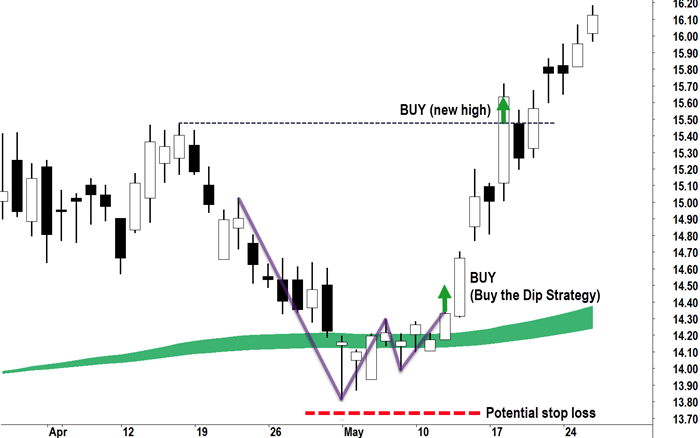
Japanese candlesticks are ideal for identifying reversal patterns that provide signals for buying on the dip. Potential reversal points are characterized by candlesticks with long lower shadows indicating sellers tried to push price lower but faced strong resistance from buyers who pushed price higher, resulting in small bodies and long lower shadows.
In the chart above, after the market declined to the support area, the price formed candlesticks with small bodies and long down-wicks.
Additionally, the long lower shadows indicate waning supply-side action as the demand-side continues to build up. The formation of a big-bodied candlestick after a candlestick with long lower shadows signifies bulls have overpowered bears, and that price is likely to start moving up. Buying on the dip would be a smart play at current levels as the price often moves up in the continuation of the underlying uptrend.
Risk management
No trading system is foolproof. Consequently, while buying on the deep, it is important to deploy some form of risk management in the form of position sizing or exit strategy. While dip-buying amounts to buying after some degree of weakness, there is usually some elevated risk of price continuing to move lower
In this case, it is important to deploy a stop-loss order slightly below the support where a buy the dip order is triggered. If the price was to break through the support level after entering a long position, one would be protected against losses accumulating.

