
Introduction
A broadening bottom (BB) is a divergent pattern in a trading chart. It takes the shape of a horn or a megaphone during formation with higher highs (testing the top trendline) and lower lows (testing the bottom trendline). The pattern widens with time as it nears breakout.

An upward breakout depicts a short-term bullish reversal since the prior price pattern is a downtrend. In a downward breakout, the bottom pattern opens the way for a short-term bearish continuation since the prior price move is a downtrend.
A broadening top (BT) pattern is also shaped like a megaphone as it widens and diverges with time. It touches higher highs and lower lows in the bottom trendline. This chart differs from the broadening bottom since it begins with an uptrend in prices.
In an upward breakout, a broadening top will signal a short-term bullish continuation. This event is caused by the uptrend in the prior price movement before the formation of the pattern. In a downward breakout, the formation of the broadening top signals a short-term bearish reversal due to the downtrend in the prior price movement.
Broadening bottom
- Downward prior price movement
Figure 1 shows that the broadening bottom begins from a downward prior price movement.
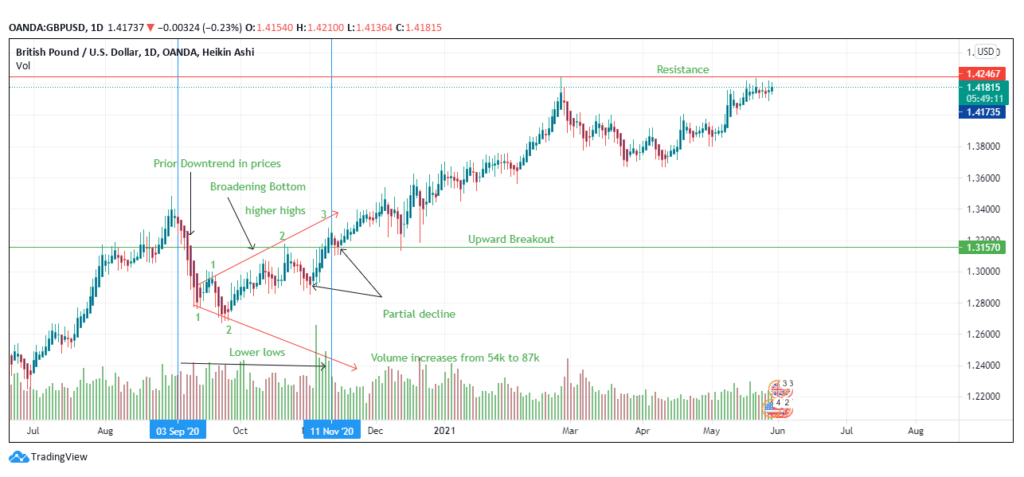
Figure 1: The BB pattern in the GBP/USD trading pair
Prices declined from September 3, 2020, leading to the formation of the pattern. The prior downward price can be close to the annual low.
- Horn/megaphone shape
The BB is megaphone-shaped as it widens over time. Typically, there are three minor higher highs (marked 1, 2, and 3 in figure 1) at the top trendline and two lower lows (marked 1 and 2) at the bottom trendline. The upper line is sloping upwards, while the bottom line is going in the opposite direction to form the horn shape.
- Breakout
The pattern is followed by an upward breakout indicating that it will usher in a short-term bullish reversal. The breakout occurs at 1.3157, where the GBP/USD pair finds support for further upward movement. The pair continues the upward trend until it meets resistance at the 1.4200 level.
If the breakout was downward, we would have seen a decline in prices, and a short-term bearish continuation would ensue at the breakout point. To confirm the breakout, ensure that the prices close slightly above the higher high of the broadening bottom (in an upward breakout). Whereas in a downward breakout, check whether the price closes below the lower low of the pattern.
- Partial decline
The presence of the partial decline, slightly before and after the breakout should prepare the trader to buy the pair as it signals a surge in prices.
The volume also increases as the broadening formation begins to take shape. The increase is caused by the growing volatility as the market prepares to sustain the bullish reversal. In figure 1, the volume has risen from 54k (at the start of the formation) to 87k (at the end of the formation).
Broadening top
Unlike BB that stems from, the broadening top begins from an uptrend in prices. The prior price movement alters the breakout scenarios as compared to the bottom.
For the broadening top, the upward breakout will indicate a buy signal to the trader since it will usher in a short-term bullish continuation. In a downward breakout, the BT pattern will initiate a short-term bearish reversal.
Both the top and bottom patterns operate on the premise that the performance of the pattern will be better based on the increasing length of the pattern. That is, the longer it takes to form, the greater the performance will be after the breakout.
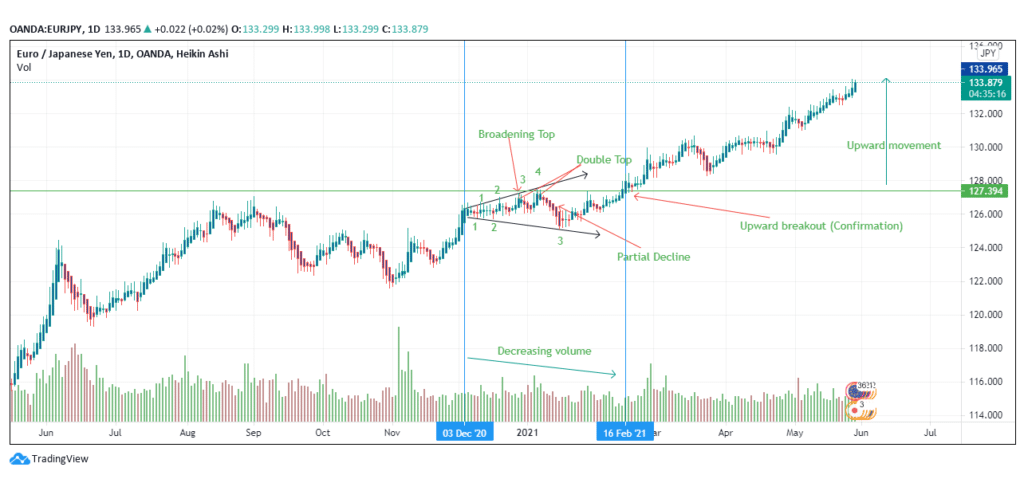
Figure 2: The BT appearing in EUR/JPY trading pair
In figure 2, the broadening top has appeared from December 3, 2020, until the breakout was spotted on February 16, 2021. The prior price movement shows an increase in the trendline towards the start of the formation. There is a double top that confirms a partial decline just before the breakout.
- Shape
The broadening top takes the shape of a diverging megaphone. The top trendline (upsloping) touches four minor highs, while the bottom trendline (downsloping) touches three minor lows. The pattern needs to touch at least two points on each trendline to confirm the formation.
The pattern forms a long formation (from December 3, 2020, to February 16, 2021), indicating that the price level will be affected significantly after the breakout.
- Volume
Unlike the BB that increases the volume during the pattern’s formation, the BT (as seen in figure 2) decreases the volume. The decline in volume is caused by the traders’ shift from a surge in buying the trading pair as the market prepares for a short retracement or a reversal depending on the breakout scenario.
However, the volume continues to increase after the breakout is confirmed. This increase is caused by the buyers’ control of the market as compared to the sellers.
- Breakout
In figure 2, the upward breakout has been confirmed at the 127.394 price level. The breakout is followed by an increase in price as the pair surpasses the vital level of 133.394. The touchpoints may influence the breakout, i.e., the number of touchpoints is directly proportional to the continuous trend of the price.
A short-term bullish continuation has higher chances to work out when there are many touchpoints (both at the top and bottom trendlines). Figure 2 has seven touch points (4 at the top and three at the bottom).
Conclusion
Broadening bottoms and tops have different trading strategies mainly due to the prior price movement. The trader should wait until the breakout is confirmed in both patterns before trading.

