Renko charts are a popular device that traders use for financial and technical analysis of the market. They filter out minor movements in price, making spotting trends easier. Learn below what these charts are and how you can use them for easy and effective trading.

What are Renko Charts?
Renko price charts are financial charts that calculate the price action for various securities.Developed in Japan only a few decades ago, they can help you capture trends efficiently. They are used in collaboration with other tools for comprehensive market study globally.
The word Renko sounds similar to the Japanese word Renga (brick) – renko charts are built using bricks, just like candlestick charts are built using wicks and a main body. These bricks are more uniform in comparison to candlesticks, and therefore may be preferred over them. They are a potent tool for capturing price fluctuations in the forex market. Small-sized bricks create more noise, larger brick sizes create smoother charts.
- Like regular candlesticks, renko charts also have colours. A green brick denotes an uptrend (bullish) while a red brick denotes a downtrend (bearish). They are visually appealing and easy-to read, making decisions clearer and accurate for traders.
- Renko charts are effective in cancelling out the market noise from the trendlines. By doing this, they remove extreme values and large deviations from the price chart, making it easier to read relevant price action.
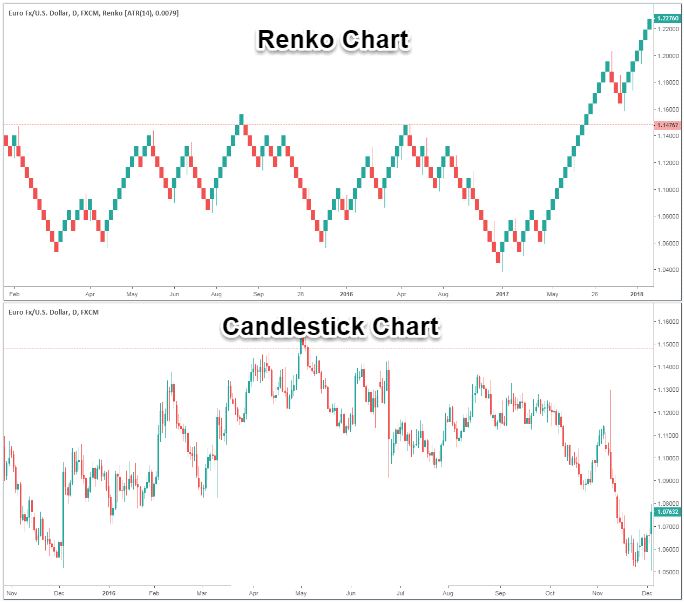
In the figure above, you can see how prices in renko charts fluctuate less often as compared to regular candlestick charts, creating smoother price bars.
In a typical renko chart, the brick size is decided beforehand. For different charts, different brick sizes are assigned, for example 20 points. These brick sizes denote price ranges (for example $0-20). Each brick has an upper and a lower boundary or limit. When the price exceeds the decided boundaries, new bricks are added above or below the brick.
Although the brick sizes are the same in a singular chart, traders can optimise the size according to their objectives. Traders with long-term investment goals will have wider bricks compared to day traders. The bricks are generally formed using the closing prices for each day, which is why renko charts are considered to be a lagging indicator.
How Can you Use Renko Charts to Capture Trends
Spotting Trends using a Renko chart: You can read uptrends, downtrends and reversals in a renko chart. With a single glance, you can get an idea about the direction of the trend – the greens show uptrends and the reds depict downtrends. The figure below is a steadily uptrending chart with periodic lows of less consequence. Although there are both lows and highs, there are no overlapping trends because of cancelling out of the noise. You can also make use of additional indicators to spot trend directions, such as the Exponential Moving Average.
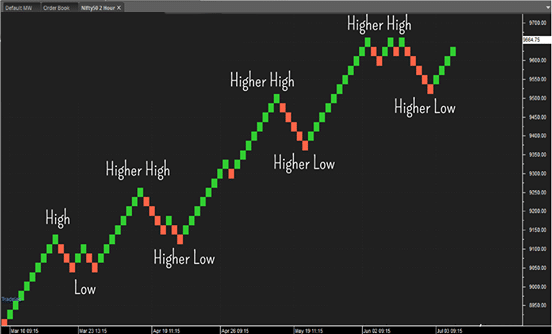
After the first registered high and low, the succeeding highs and lows registered are resistance and support levels. You can also notice trend reversals clearly.
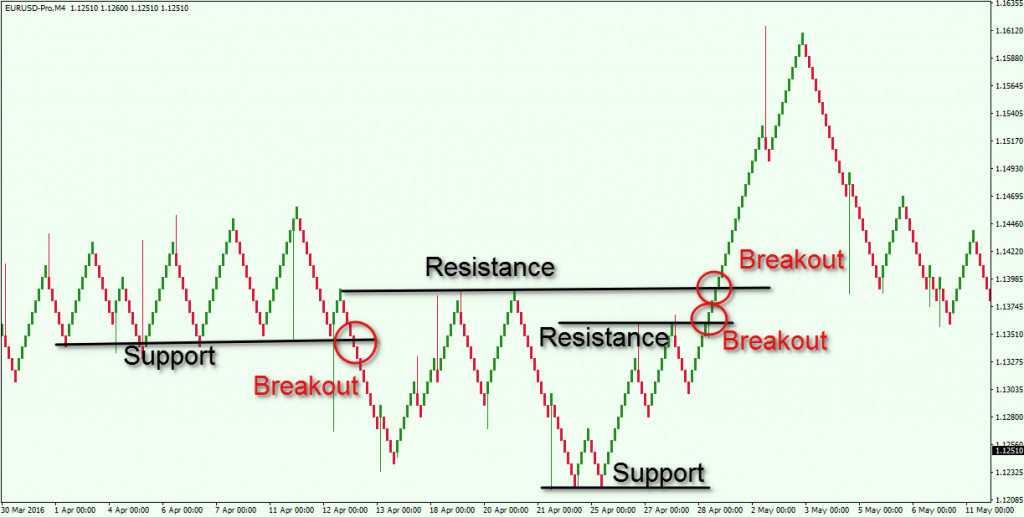
Support and Resistance Levels: Support is a price floor at the lowest point in a downtrend when it stops and begins to rise; whereas Resistance is a ceiling at the highest point in an uptrend when the price stops and begins to fall. Renko charts are good at capturing support and resistance levels in forex. The two aspects are important to note as they give a close idea about trend reversals. Breakouts are points where new trends are created diverging from previous support or resistance levels. For different traders, the preset pip movements help create even more precise support and resistance levels for individual objectives.
Renko Chart Patterns: Renko charts also form patterns. Some patterns that occur frequently in these charts are the bullish and bearish channels, rising wedges, head and shoulders etc.
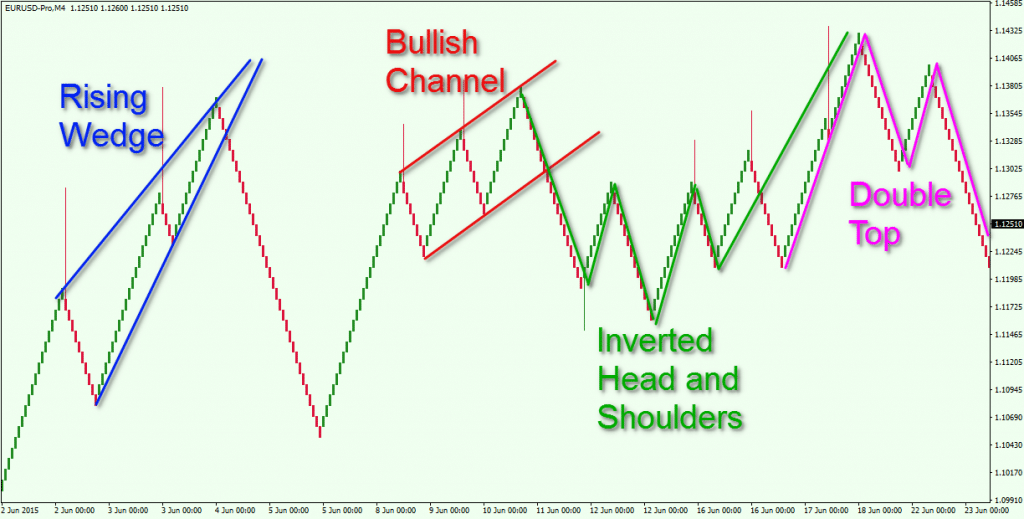
- A bullish channel is a pattern that creates a series of uptrends and downtrends that are ultimately rising.
- A rising wedge forms a steep uptrend with minor downtrends.
Using the trends confirmed by renko charts, you can place your stop-loss at the highs and lows wisely.
Downside of Renko Charts
Even though Renko charts prove as a useful tool for technical analysis, they do lack in some aspects.
- Do not include volume: Since renko charts only consider price changes as a variable, they do not include volume – which is an important variable that represents the strength or weakness of a trend.
- Do not consider the time factor: The time intervals between different bricks are uneven which makes it difficult for traders to make time-bound decisions. There is inconsistency in short-term and long-term market analysis.
- Individual bricks do not convey enough information of the high, low, open and close prices for different days accurately.
- The bricks/blocks in renko charts are more uniform than other charts – however this comes at a cost. While filtering out the market noise, some vital price information may be lost in a renko chart.
- A renko chart is a lagging indicator – the chart is updated only when a new brick is created. Therefore the chart will show the price that created the last brick.
Bottom Line
Renko charts remain a widely used tool in the forex market for their simplicity and usefulness. You can use them to spot market trends and reversals easily. Despite taking limited variables into account, they paint a very clear picture of the price action and cancel out noise and larger deviations. Some argue that other modes of analysis, such as the Heikin Ashi, prove a better charting technique. However, traders also use renko charts to predict the outcome of a major event like an election, or a change in the monetary or fiscal policy – when the noise in the market at its peak. Use renko charts combined with other technical indicators for a complete market analysis. Always rely on detailed risk allocation and portfolio management for profitable trading.

