What is Commodity Channel Index?
The Commodity Channel Index or CCI is a momentum-based oscillator. Traders use it to determine overbought or oversold periods in the market. It appears very similar to the Relative Strength Index or RSI but comes with its own set of benefits and disadvantages. Traders can also use the CCI to assess price trend direction as well as its strength. Traders can use this information to determine whether they want to enter a trade, exit a trade, not take a particular trade, or add an additional position to an already existing one.
The CCI indicates whether the current price level is far below or above the moving average, which the trader sets. The oscillator line moves higher (in case of an uptrend) or lower (in case of a downtrend) from the zero points. This increases as the price deviation in the short-term relative to its averaged value get stronger.
The CCI is an unbounded indicator. This means that it can indefinitely go higher or lower. This is why traders determine the overbought or oversold conditions for each asset individually. They do this by looking at the historical extreme CCI levels, from the point at which the price reversed.
History of Commodity Channel Index
Donald Lambert created the Commodity Channel Index or CCI in 1980 introduced in the Commodities Magazine. According to what he wrote in the magazine, he felt that many commodities exhibit some type of seasonal or cyclic price action. However, commodity traders still faced the problem of detecting the beginning and end of regular price movements. This is because the climate and other real-world conditions have an effect on their timing.
Thus the CCI was the standardization technique to determine a commodity’s fluctuations. Donald Lambert introduced the CCI in the midst of a surge of commodity speculation in the market. In present times, the CCI has become one of the most common technical indicators on almost all charting software for technical analysis. Even though the CCI was ideal for cycle analysis originally, it has now become a common effective tool for chartists and technicians.
How can Commodity Channel Index be adjusted?
The Commodity Channel Index is a leading indicator which traders use to identify both overbought as well as oversold conditions in the market. In addition to it, bearish and bullish divergences can also detect early changes in momentum and possible trend reversals.
- Identifying new trend: Generally, the CCI the -100 to +100 range. An extended move may likely occur if any move exceeds this range, signaling either unusual strength or unusual weakness. Thus we can say that when the CCI shows a negative value, it supports a bearish sentiment. Alternatively, when the CCI shows appositive value, it supports a bullish sentiment. A trader, however, has to be careful of whipsaws if he/she uses a zero line, expecting crossovers of it. However, if one waits for a move beneath the -100 level or crossing the +100 level for entering into a long and short position, respectively, the occurrence of whipsaws decreases greatly.
- Identifying Overbought and Oversold conditions: Using the CCI to estimate overbought or oversold conditions makes it a subjective matter as there are no up or down limits in the indicator. In a flat trend trading range, traders can apply the -100/+100 range to fit the overbought and oversold concept. However, in situations such as in markets that are strongly trending, traders should apply a more extreme level such as a -200 level and +200 level for oversold and overbought conditions.
The CCI below -200 indicates that the tradable instrument is oversold, which implies that the price can rise. In such cases, traders should enter into a long position when the CCI crosses the “ -200“back to the upside. Similarly, when the CCI is above the +200 level, it indicates that the tradable instrument is overbought. This implies that the price may begin to fall. Traders should enter into a short position when the CCI reaches back to the downside after crossing +200.
- Bullish and Bearish divergences: When momentum fails to confirm a particular price, divergences can indicate a potential reversal level. When the CCI makes a higher low, and the tradable instrument’s price reaches a lower low, it implies weak downside momentum. Hence, bullish divergence forms. Similarly, a bearish divergence forms when the CCI reaches a lower high, and the price of the tradable instrument reaches a higher high. It implies that the upside momentum is weak.
Basic Strategies Using Commodity Channel Index
Short-term Commodity Channel Index and Moving Average
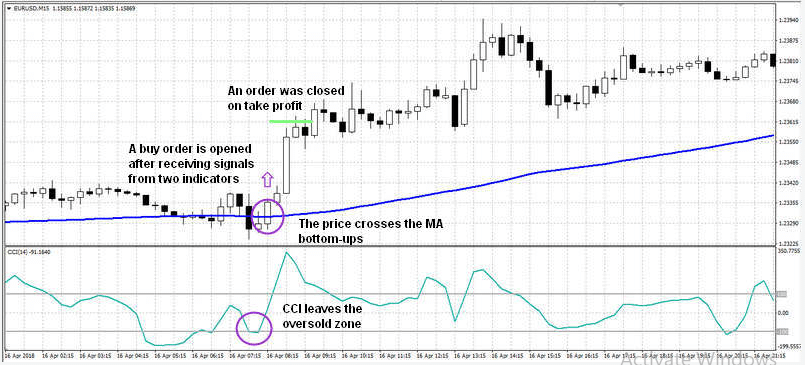
Traders can add a simple moving average indicator with a period of 100 to the Commodity Channel index. This can improve signal quality and trading efficiency. This trading strategy is ideal for traders interested in short-term trading. In this case, the moving average acts as a support/resistance line, and traders should open orders when prices retrace from the Moving Average.
The optimal timeframe for trading, in this case, is M15. Traders should add scalping at M5. Traders can open orders in the following ways:
- When the price crosses the moving average in the same direction, with the CCI crossing the +100 level from below, traders open a sell order.
- When the price line intersects the MA chart from below, and the CCI leaves the oversold zone, a trader opens a buy order.
Traders can exit order by fixing take profits and stop losses. They should maintain a P/L ratio of 3:1.

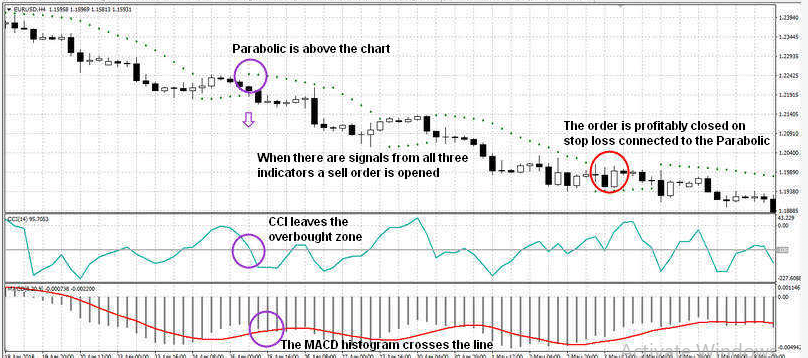
- Strategy Combining CCI with the Parabolic SAR and MACD: Traders can combine the Moving Average Convergence Divergence, Parabolic SAR trading, and CCI for this trading strategy suitable for both beginners and experienced traders. Traders must first set all three indicators with default settings. The optimal timeframe for trading is, in this case, H4.

When using this strategy, traders should open sell orders under the following conditions:
- When the histogram(MACD) crosses the line.
- When CCI falls below +100, leaving the overbought zone
- When the Parabolic SAR marker is above the chart after changing its position.
Traders should open buy orders in the opposite condition. The system generally offers a degree of flexibility when closing the positions. Traders can use the Parabolic marker to move the stop loss and set the exit price manually. Without limiting their profit to any pre-determined level, traders can capitalize on the entire trend. This strategy suits the price action dynamics of the forex market.
The Bottom Line
The Commodity Channel Index is thus a reliable and effective indicator, useful for identifying entry points in the market when used with other indicators. However, it comes with its own sets of disadvantages, so it’s better to rely on traditional signals for closing positions. The CCI can move very from the overbought to the oversold zone very quickly in the presence of a strong trend. If traders perceive this as a reversal signal, he/she may lose most of the profit from the original position.
So, the Commodity Channel Index is, first and foremost, a filter for eliminating the false signals from other indicators.


