A reversal is a change in the trend of the price of a commodity, stock, or any other security. It is usually the clearest indication for a trader to know whether to buy or sell. This, therefore, means that being able to spot signs of an impending reversal is key to succeeding as a trader. A reversal should, however, not be mistaken for a retracement, which usually has a comparatively short time span.
Signs to help you identify trend reversals
- Assess the strength of the established trend. If it was an uptrend, the highs and the lows can help you determine whether the trend is gaining strength or becoming weak. If the higher highs start becoming lower highs or if, the lower lows replace the higher lows, then you know that the trend is about to reverse.
- Changes in indicators. Crossovers build a strong case for a reversal when they occur on indicators such as parabolic Stop and Reverse (SAR) and moving averages. Also, the shrinking in the sizes of candlesticks on either the uptrend or the downtrend serves as a signal of a potential breach to key resistance and support levels.
- The volume of trade. A significant reduction or rise in the volume of trade is a sign that the market is either oversupplied or undersupplied. This usually exerts pressure on the price to break an uptrend or propels it higher. Indicators such as the Relative Strength Index (RSI) will help you understand whether the stock has been oversold or overbought.
How do you determine whether there’s a trend?
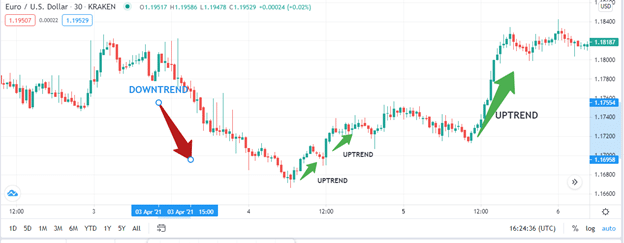
Well, the obvious way to know if a trend is in play is by looking at the direction of alignment of a price movement. This means that the trend will either be moving upwards, downwards, or sideways. However, this alone doesn’t usually tell the whole story. That’s why you should look at the type of candlesticks being formed. Generally, the more bullish candlesticks are present, the more likely the trend will become bullish. The same applies to bearish candlesticks and bearish runs.

Spotting the reversal
1. Keep an eye on the bullish candlesticks
As mentioned above, the sizes of the candlesticks also have a bearing on the trend. The smaller the candlesticks become, the more the current trend is weakening. This applies to both bullish and bearish candlesticks. Alternatively, if bullish candlesticks are becoming smaller, it means that the sellers are gaining ground, and as a result, the prices are under a lot of pressure. The buyers may therefore be losing their grip. The reverse is true when bearish candlesticks become smaller.
2. Look at highs and Lows
A strong bullish trend is characterized by consolidation of prices over short intervals, and the price will be hovering above the first support level. However, if the bullish trend is weak, the prevailing prices will be consolidated over wide margins, and the price will frequently slip below the first support level but stay at or above the second support.
Once the second support level is breached and the price plummets below it, then know that a bearish reversal is in play. Generally, the price should keep off the two support levels for an uptrend to be strong. The more it revisits a support level, the weaker it is becoming.
Also, the higher highs and lower lows will guide you in detecting a potential reversal. For weak uptrends, the higher highs will transit to lower highs, and higher lows will move to lower lows.
3. Use indicators
Moving averages
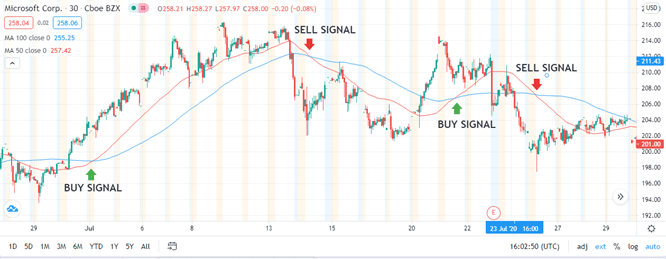
The use of moving average indicators is one of the most effective ways of knowing whether or not a trend is on the verge of a reversal. The rule of thumb for day traders is to use shorter periods and for long-term investors to employ longer periods. For example, day traders may use 50-period moving average (shown in red below), while long-term traders may opt for a 100-period moving average (shown in blue below).
When these indicators are plotted, a trader should be guided by how they cross each other. When the 50 MA crosses the 100 MA from below and goes above it, the market is becoming bullish, and it’s time to buy. Conversely, when the 50 MA goes below the 100 MA, the trend is becoming bearish, and the next action is to sell.

While the moving average strategy is good, it’s not foolproof. Many underlying market forces may be at play and may defy the crisscrossing of moving average. You should, therefore, never turn your back on the direction of the trend. Using this principle, you should only go short in a downtrend if the shorter simple moving average crosses the longer simple moving average from upwards and goes below it.
Using parabolic SAR trends
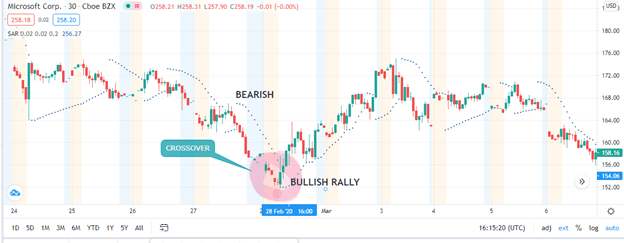
This tool presents itself in the form of dots, whose direction in relation to the price should help you determine whether the trend is about to reverse or not. A breakout is represented by the movement of the dots across the price trend line. For a bullish reversal, the dots will cross the price candlesticks and go below them. For a bearish reversal, the dots will move above the price.

Watch out for pullbacks
Moving Average Convergence Divergence (MACD) and Relative Strength Index (RSI) are popular oscillators that a trader can use to spot reversals. These oscillators can tell us the relationship between a stock’s price and its supply/demand. By looking at the movement of higher highs and lower lows, we can tell, to a great extent, whether or not a trend is about to break.
The strategy is based on the principle that for a trend to be sustained, there has to be congruence between the higher highs and lower highs during an upswing and lower highs and lower lows on a downtrend. If that doesn’t happen, a divergence/market reversal is in the offing.
Bottom line
Market reversals are one of the ways you can tell that it’s time to go long, go short, or exit trading. The most important factor to consider is to detect the reversal before it happens. The factors discussed above will equip you to do this, but you must know when to use which tool. It is also important to keep your eyes on other market forces that may defy the indicators.


