
Donchian Channels is a technical analysis indicator focused on volatility. Richard Donchian created the indicator in the 1960s. The channel is determined over a period of time by high and low asset prices.

The primary use of this indicator is giving alerts for a long or short positioning.
Donchian Channels are also suitable for a crossover approach combined with the Moving Average.
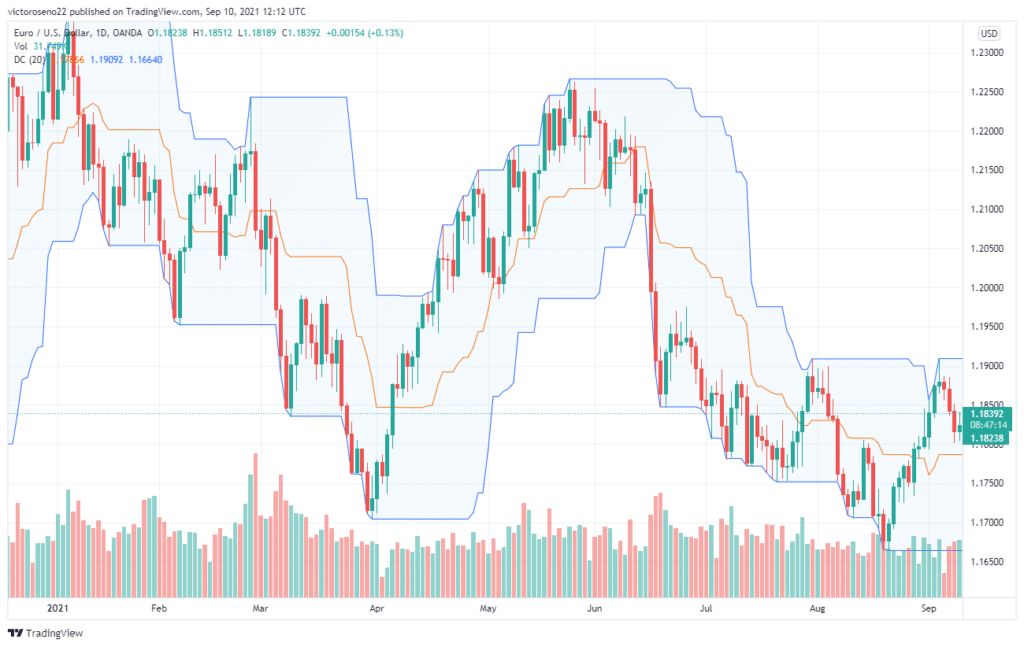
If you take the highest high over the defined period, you’ll get the upper boundary of the band. The bottom border represents the lowest low, while the middle line is the mean for both.
A daily chart of the EURUSD pair with a Donchian 20-day Channels is presented in the above chart.
Ideally, the Donchian Channels will be significantly wide if sufficient volatility is present in a given time. In a limited period, the Donchian channels will be quite narrow if there is low volatility.
Donchian’s four-week rule
The four-week rule is as straightforward as it gets. It is divided into two parts:
when the price reaches the high of the four prior full calendar weeks, establish a long position and liquidate any short positions.
When the price falls below the four previous full calendar weeks’ low, initiate a short position and close any longs.
The trader will, in principle, always have a position open. However, astute readers will have seen an obvious flaw in this trading strategy: the Four Week Rule does not perform well in sideways markets when prices are typically trading inside a range.
How to calculate Donchian Channels
Usually, this indicator is calculated in a very simple method, even though it operates on three bands that are shown in the chart above.
Here is the efficient way of calculating Donchian Channels.
UB = Highest High in Last N Periods
Middle Band=((UC+LC)/2)
LB = Lowest Low in Last N periods
where:
UB=Upper Band
N= Number of minutes, hours, days, weeks, months
Period=minutes, hours, days, weeks, or months
LB=Lower Band
Most traders like the 20-period default setting. However, they may select any time window from minutes to hours or weeks.
Nevertheless, the performance depends on the selected timeframe and the conditions of the market at the time of entry.
Dochian channels trading strategies
There are three bands in the Donchian Channels. Probably the most significant are the two outside bands. In these two bands, the strength of a trend is generally apparent.
In a strong uptrend, the price typically touches the upper band of the indicator. On the contrary, the price generally tests the lower band of the channel in a downtrend.
The combination of the Donchian Channels is another common trading method. This is a strategy similar to the two Moving Averages crossover.
The goal is to have two different time period DC indicators. You can have the settings of 20 and 10.
By clicking on the chart, you may alter the color of such bands. Due to the plotted six bands, the chart seems a bit confusing when you apply the indicators. This may be sorted by adjusting the colors of the bands in the following chart.
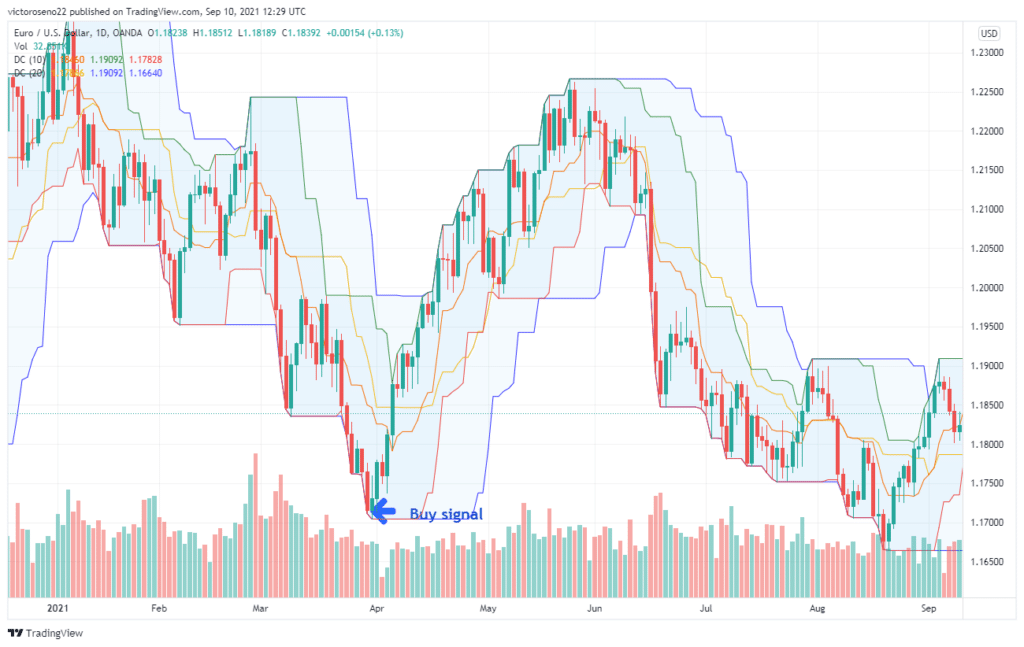
When the price of an asset exceeds the band of the lengthier period, an entry signal is generated. If the candle closes below the bottom band, you will have a buy signal. In the chart above, you can see the candle closing below the lower band of a lengthier period DC, thus generating a buy signal.
Pros and cons of Donchian Channels
Let’s look at some of the strong sides of the Donchian Channels indicator.
Strengths
- Function well in the non-trending market environment
- Excellent market volatility measurement indicator
- Useful for identifying overbought and oversold areas
- Functions as a dynamic resistance and support area
- Excellent for recognizing large market moves
Weaknesses
- Poor at market cycle reversals, generating many false signals
- It should be used in combination with other instruments
Donchian Channels vs. Other Indicators
There are other indications similar to Donchian Channels. The closest indicator to Donchian Channels is Bollinger Bands.
While both employ lines to create channels and depict the price movement, traders should learn to avoid getting confused by the way the indicators are plotted on a chart. This is one of their key distinctions.
The Bollinger Bands use a Simple Moving Average, while Donchian Channels use the highest and lowest prices.
The way both indicators interpret breakout signals is a major difference.
While a breakout signal is a probable turnaround in the Donchian Channels, the scenario is different for the Bollinger Bands. If the price breaches the upper or lower bands of the indicator, the signal shows that a new move may proceed in the same direction or in the opposite direction.
To choose which indicator to employ, consider the nature of the traded market, your risk tolerance, and beliefs about the market.
Conclusion
The Donchian Channels are certainly the easiest indicator for novices to understand. In addition, they are less dynamic and react slowly to changes in price, simplifying their use, unlike Bollinger Bands.
Richard Donchian wanted the safest approach to take advantage of trading commodities. The indicator is named after him for his risk-averse strategies.

