Introduction
The three falling peaks chart pattern as the name suggests has three peaks with each peak having a price that is lower or almost equal to the previous one. It is depicted by a falling staircase formation and a short-term bearish reversal of the price trend. The pattern begins with an uptrend in prices, with two valley-like formations between them.
Traders should understand that the peaks denote a break towards the downside. The first peak’s high position is slightly higher than the second, while the second peak’s high is higher than the third peak. In a research done by Bulkowski, the three falling peak patterns have a break-even failure rate of 4% in a bear market as compared to 12% in a bull market. This situation means that the appearance of the pattern mostly denotes a downward breakout as compared to an upward breakout.
Identification
1. Found at the end of an uptrend
The first peak of the falling peak pattern is always located at the end of a price uptrend. It acts as the first reversal point before it recedes and forms peak 2. The first peak is followed by a stair-step decline.
2. Peak formation and proportion
The first peak is higher than the remaining two. The peaks recede in size and they should not be mistaken for triple or double tops that have an equal proportion. In appearance, the falling peaks have similar shapes and magnitude. However, the two last peaks have minor highs and operate with different volumes. If a trader is interested in wider peaks, the 3 peaks should have a higher volume to help in establishing the trade pattern.

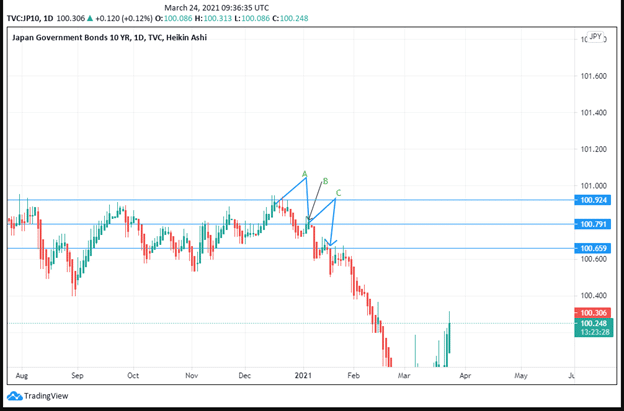
Figure 1: Japan’s 10-Year Government Bond
Figure 1 shows the three falling peaks present in Japan’s 10-year government bond from December 2020 to January 2021. The first peak A is highest at 100.924, the second B, is at 100.791 while the third C is at 100.659.
The first peak begins from an uptrend in prices and joins the second peak through the valley. The second and third peaks are formed from upward retracements. The peaks also form near the yearly highs. The position of peak A 100.924 is the highest annual position of the bond as viewed in the trading chart. This peak position should prepare the trader to sell short. We expect to see a downward breakout that will confirm the bearish position.
The pattern is confirmed as valid if the closure of the price occurs below the lowest valley. In the case of figure 1, the price should close below 100.600 for it to be a three-falling peak pattern.
Trading Strategy
1. Measure to get the target price
Compute the target price by getting the difference between the heights of the highest peak (the first peak) with the depth of the lowest valley position.

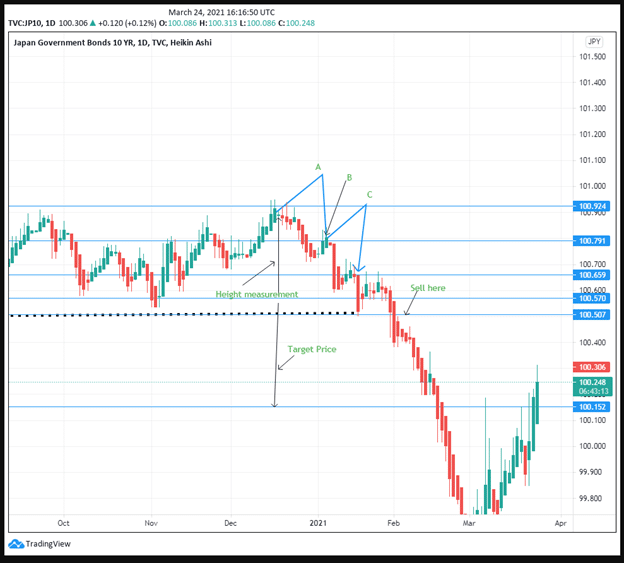
Figure 2: Target Price Computation
The target price according to figure 2 has been placed at 100.152. The difference between the highest peak and the lowest valley is 0.354. This amount should be subtracted from 100.507. To ensure no substantial loss is incurred the trader should place a stop loss at 99.400, the same distance below the target price.
Putting the stop loss the same distance after the target price has proven to be a safe bet especially if we consider trend movement in figure 1. Price has moved to 99.431 before it began rising again to the high of 100.306. The target price can range from 20-100% of the height of the highest peak.
In the case of figure 2, the high volume of peak 1 gives room to a stronger bearish turn. The trader should be prepared to sell to achieve more profits immediately after the downward breakout is confirmed.
Before a 20% retracement takes place the average maximum decrease of the price is mostly 17%. Prices will also pull back at least 59% of the time towards the breakout signal within a month or 30 days. In figure 2, there was a pullback in prices that confirmed the sell position. There was a decline from 100.570 to 100.507 from mid-January 2021 to February 2021.
2. Identify the valley short
Short the stock after identifying the confirmation line. This point is located in the valley below the prior price trend line. The selling position as shown in figure 2 is at 100.507 slightly below 100.570 where the first peak began to rise. The trader should identify this location as central in calculating the price target and setting up the short position.
Remember to place a stop loss if any of the prices rises above any of the three peaks. This situation will signal an upward breakout and not a downward breakout. In such an instance, the short should be covered with a stop loss slightly above the peak position.
We can also use this valley to calculate the downward target of the security price. Here is the formula
- Compute the height of the second valley (L2)
- Get the price of the height of the first valley (H1)
Subtract L2-H1, then multiply the result by 33%.

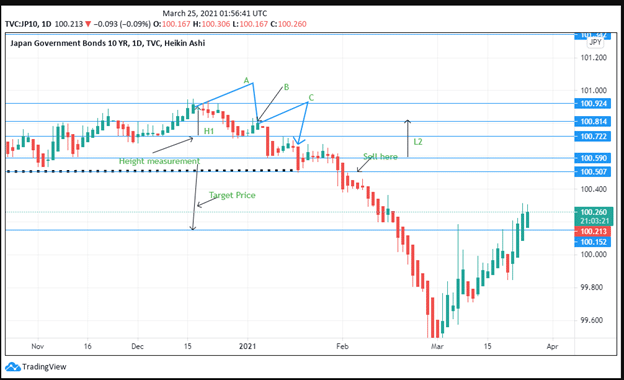
Figure 3: Using the Valleys to compute the target price
In the case of figure 3, it should appear as follows:
H1-100.924-100.722=0.202
L2-100.814-100.590=0.224
0.224-0.202=0.022* 33%=0.726
We should then subtract this amount from 100.507- the pullback position. The answer is 99.781. The valley, as we have seen in figure 2, goes deeper than the measure rule. It is then better to use the valleys of the falling peaks to get the target price. Use the stop loss to ensure the trade is covered in case the price continues to go lower.
Conclusion
Using the valley price positions to determine the target price for securities is more effective than computing using peak positions. The 3 falling peak pattern is essential in determining the shorting positions of stock. Traders should first get the confirmation line based on the prior price analysis. This line will then be subtracted with the valley short position to get the target price. The pattern is identified by 3 peaks with declining positions that indicate a downward breakout.


