Most knowledgeable forex traders will have heard of Dr. Alexander Elder, a highly renowned trader, psychologist, educator, and the author is known to have written several influential books in the 90s and 2000s.

Like any legendary enthusiast of the financial markets, the Estonian-American also developed a unique technical indicator named the Elder’s Force Index (EFI). The Force Index is an oscillator of the newer generation in forex.
As the name suggests, the main job of this tool is to measure the force behind an instrument’s price. It was first published in Elder’s Trading for a Living book released in 1993. In his classic work, Elder described the three key elements moving the price of any asset: direction, extent, and volume.
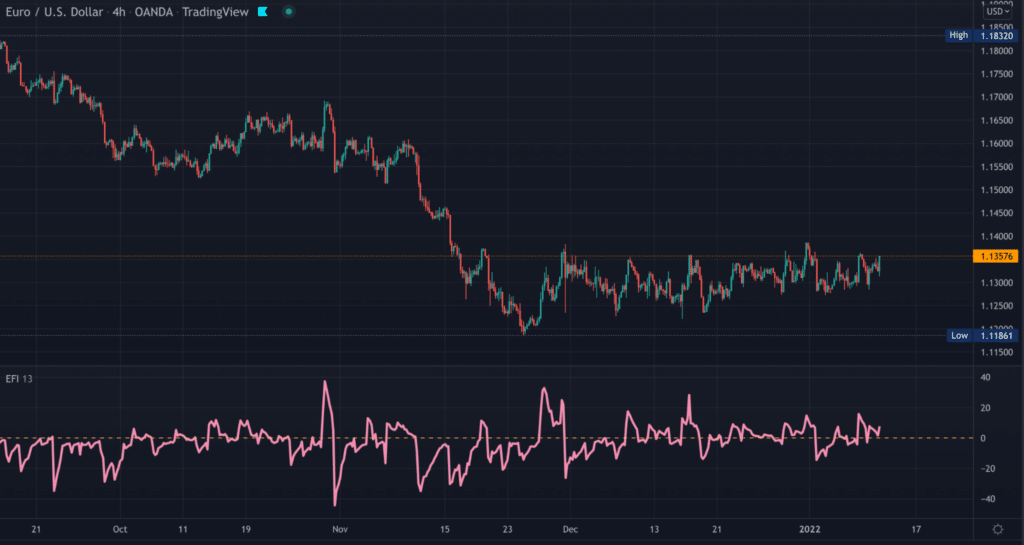
The EFI is an oscillator at its core, fluctuating between positive and negative territories as the force shifts from one side to the other. This indicator helps confirm the overall trend on your preferred time frame, and like any oscillator, can help you spot potential reversals through divergences.
Let’s explore more behind this tool and examples of implementing it in your trading.
Component of Elder’s Force Index
The core components of this indicator are price and volume, represented as an oscillator with a zero centerline. Unlike most oscillators, the y-axis of EFI is not bound to any figure, meaning it can go up or down infinitely depending on how strong price movements are.
EFI consists of a simple calculation taking the current period’s closing price, subtracting the prior’s period closing price, and then multiplying the volume as such:
[current period closing price – prior period closing price] X volume.
The result is extrapolated using a 13-period Exponential Moving Average as a default setting adjustable based on a trader’s preferences. As the periods become higher, the ‘smoother’ the index becomes. You should find EFI with the most popular charting packages as a built-in indicator.
The simple idea behind the index is that if the current period’s closing prices are higher than the previous period, the force is positive. Conversely, the force is negative if the current period’s closing prices are lower than the prior one.
When you interpret the index, you understand whether the market has progressed on the downside or upside and by how much volume. In practical terms, when the index is above zero, traders should expect rising prices. If the index is below zero, traders should anticipate falling prices.
Let’s now observe how you can use the force index to generate trading signals.
Examples of using Elder’s Force Index
As with most indicators, it’s best to use EFI in conjunction with another indicator; you should never rely on this tool on its own. Generally, traders combine a momentum-based tool with a trend-identifying tool, most commonly Moving Averages.
In his book, Trading for a Living, Elder advocates for trading with the trend. Therefore, one of the primary purposes of the index is to confirm this idea in the markets.
Traders could employ a 50-day Exponential Moving Average (EMA) to determine their overall bias and then use the index to pinpoint an entry trigger by observing when it goes above or below the zero line.
For consistency, one may want to configure the EFI to 50. When the price is above the EMA, we consider this event an uptrend; when the price is below the EMA, we regard this event as a downtrend. Let’s delve into a recent example.
Trend identification
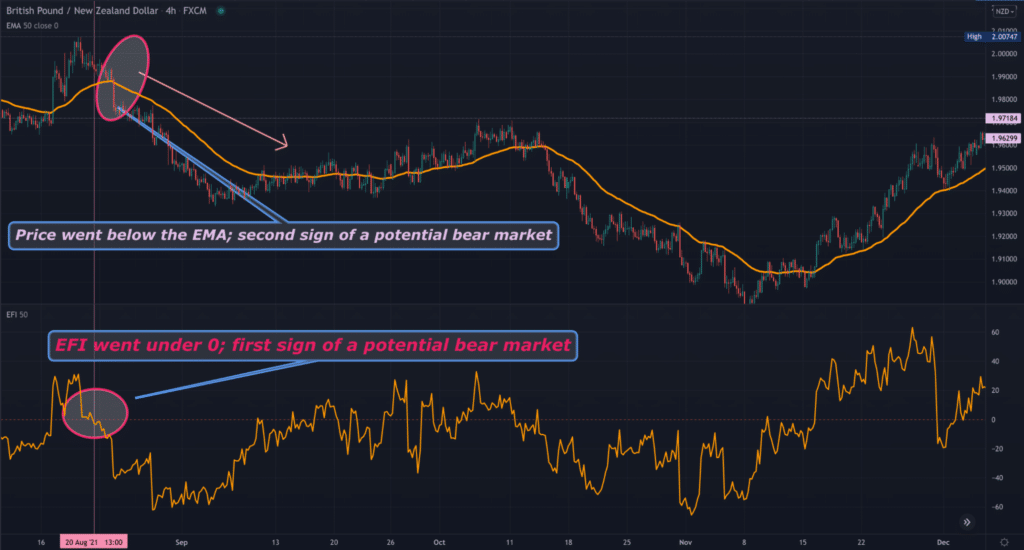
From the left of the chart below, we can see the price was above the EMA, suggesting bullish movement. Eventually, the trend changed to a reasonably sustained downtrend, and there were two triggers one could have noted as highlighted.

The index will typically provide the first sign of a potential new move in such scenarios. Yet, a conservative method is waiting for additional confirmation from another indicator like the Moving Average.
So, you could have taken an entry at the point marked with an ellipse. One may have held the position and closed their trade when the index passed above the zero line, suggesting some bullish movement.
Divergences
No oscillator would be complete without good ol’ divergence. As we know, divergence occurs when chart price moves in a counter direction to reading on an indicator, most often an oscillator. The divergence we’ll cover in our example below is bullish.
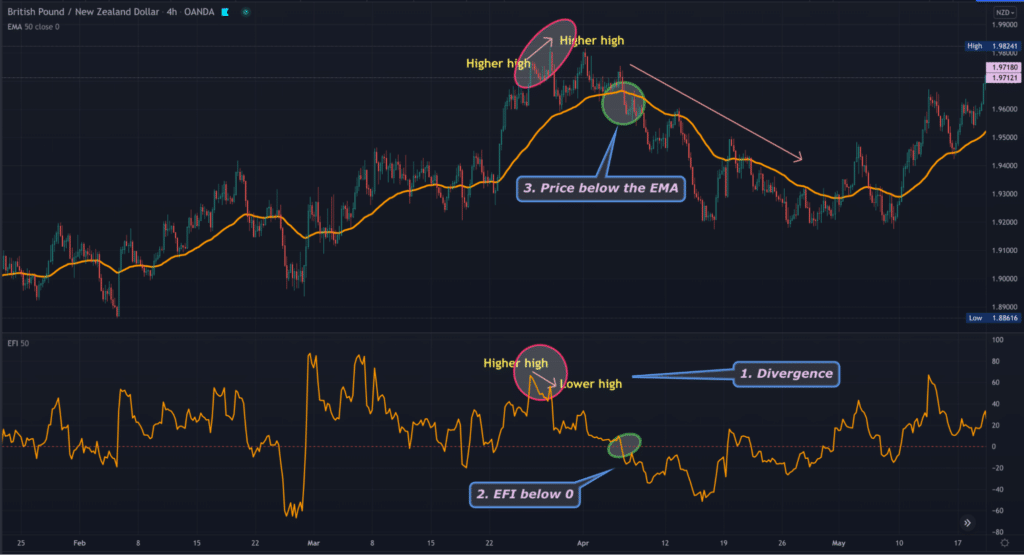
With bullish divergence, price shows two consecutive highs while the oscillator shows a higher high and a lower high when aligning both points (see the below).

Divergences are still one of the tried-and-tested methods to spot and trade reversals with decent predictive success. However, as with any technique, you need additional confirmation factors rather than acting on a divergence alone.
Identifying the divergence would have provided a sign of a potential new trend. Similar to the last example, waiting for confirmations from the EMA and EFI can increase the chances of success with this setup.
We’ve marked the instances where the index was below zero and the price underneath the EMA, providing the final entry triggers. Therefore, a trader will have had three reasons to take this position; divergence, the index, and Moving Averages.
Final word
Ultimately, Elder’s Force Index is like a combination of the Money Flow Index mixed in with an oscillator. To better understand this indicator, reading the Trading for a Living book would be helpful.
Here, the author goes in-depth about what they believe as the three most important factors influencing price, namely direction, extent, and volume. It’s pretty amazing that, almost three decades later, not much has changed in the markets.
Yet, let’s not overestimate the predictive ability of this tool because it’s still a lagging indicator no matter the settings used. Therefore, as with anything in forex, you should always combine it with other indicators and techniques.


