
Introduction
Knowing when to enter and exit a trade is the most essential element of forex trading. The entry point is the price level at which a trader executes the trade, either buying or selling of a currency pair. The exit point is the price level at which the trader closes the trade. Proper planning is required of traders before hitting a buy or sell order as it could result in losses. After entering a trade, risk management analysis, as well as setting profit targets, is needed to mitigate losses upon exit.

Short-term investors in the forex market can be day traders or those that do not extend their trading positions by more than a week. Long-term investors hold their forex positions for weeks, months, or even years, depending on their trading accounts. These two traders have different styles of entering or exiting the market due to their risk management strategies.
Short-term traders
Candle-sticks formation analysis
Traders may assess the pattern of the candlesticks before entering the market. Candlesticks form hammer or shooting star candlesticks.
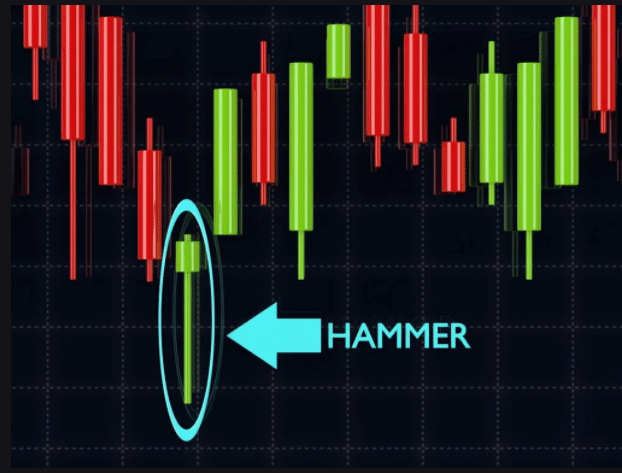
Figure 1: Hammer candlestick formation
The hammer candlestick shown in figure 1 mainly prepares the trader to make a bullish move while the shooting star acts opposite to the hammer.
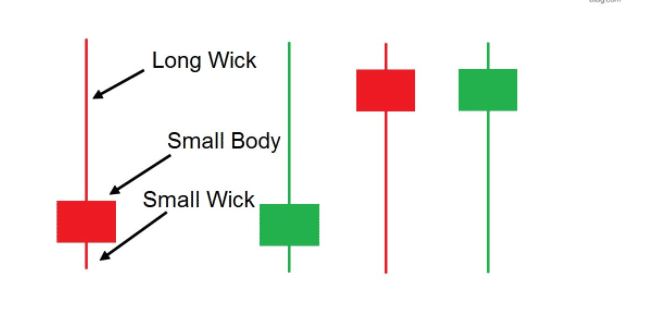
Figure 2: Shooting star candlestick
The shooting star candlestick prepares the trader to enter the market from a bearish or selling perspective rather than buying. Both the body and the length of the wicked help in this assessment before market entry. The trader should check if the length of the wick is 2 or 3 times the size of the body before making a significant move.
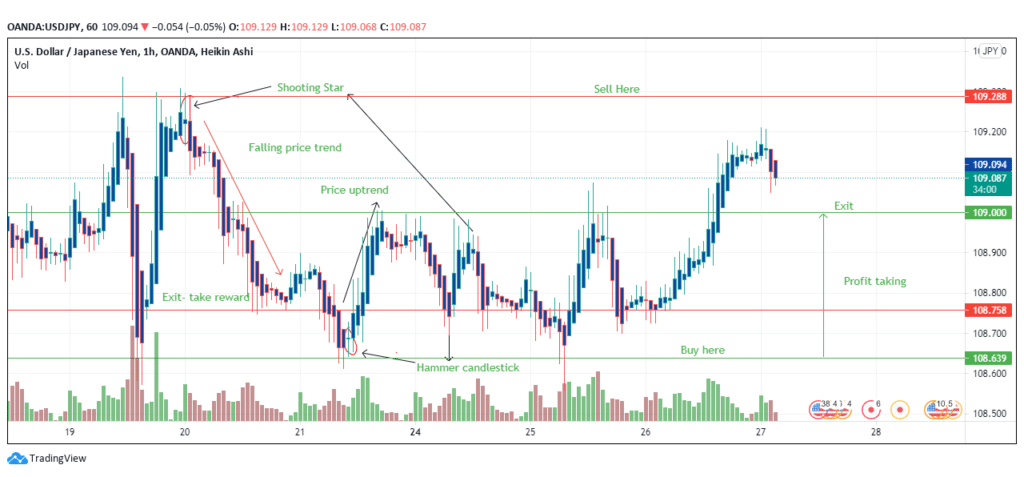
Figure 3: USD/JPY trading chart analysis
Figure 3 shows the price pattern that follows the shooting star and the hammer candlesticks in an hourly chart. It is important for the trader to first ascertain there is movement at other price points before first entering the market based on a candlestick assessment.
The red lines show the sell orders for entry and exit, while the green lines indicate the buy order entry and exit. After assessing the candlesticks, the trader executes the sell order with the price level of 109.288. He exits the market at 108.758 gaining 53 pips in a matter of hours. On the buy-side (green lines), the trader buys the USD/JPY pair at 108.639 and exits at 109.000 (gaining 36 pips).
Trendline breakout
This strategy works on the premise that when there is a break in the trendline in a trading chart, there forms a “potential” alteration or change of the trend. In simpler terms, if a trendline was moving downwards and a breakout appears, the trendline will change course in the short term and move upwards.
The trader should enter the trade by buying into the pair if the upward breakout happens and sell if there is a downward breakout. The entry and strategy here are all about the breakout. If you have bought into an upward trendline, be prepared to exit once the downward breakout happens. This strategy qualifies to be a short-term pattern since the trader focuses on accumulating profits within a short set of time due to market volatility.
Let us take the example of the USD/JPY trading pair and consider the analysis of the price chart.
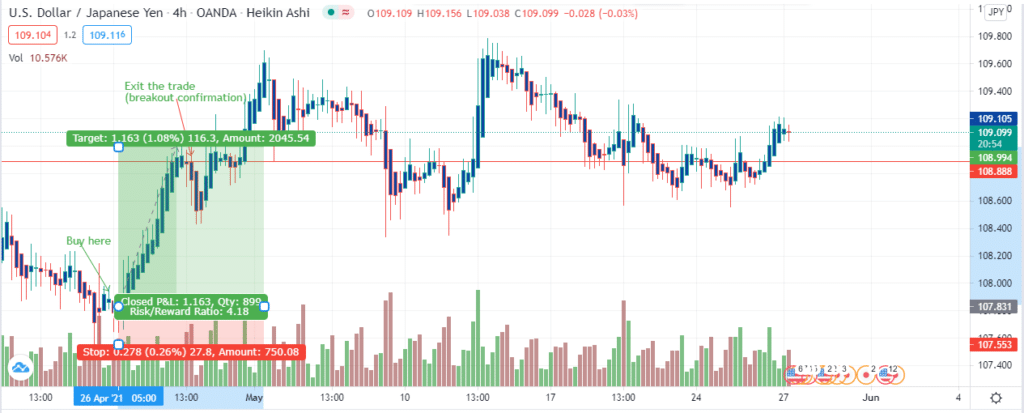
Figure 4: Entry and exit using downward breakout
In figure 4, we entered the trade in the 4-hour chart on April 26, 2021, at 107.831. The target is to reach price 108.994, where we will have accumulated 116.3 pips. As a necessary precaution, we have placed the stop loss 27.8 pips below our entry position. The buy order follows an upward breakout that supported our long position.
After reaching our target price, the trading chart confirmed the downward breakout at 108.888. At this point, we exited the trade, having accumulated our profits. The same strategy is employed when selling a forex pair after the formation of the downward breakout. The trader is free to exit the trade even before reaching the target price. Market volatility may disrupt the price trendline causing a shift in position. If you are a short-term trader, avoid moving against the market.
Long-term traders
Technical analysis
Traders apply technical analysis to assess and predict the movement of a forex pair both in the short and long term. To assess technical patterns, the trading chart is set at daily, weekly or monthly periods. There exist various patterns that traders use to predict price movement.
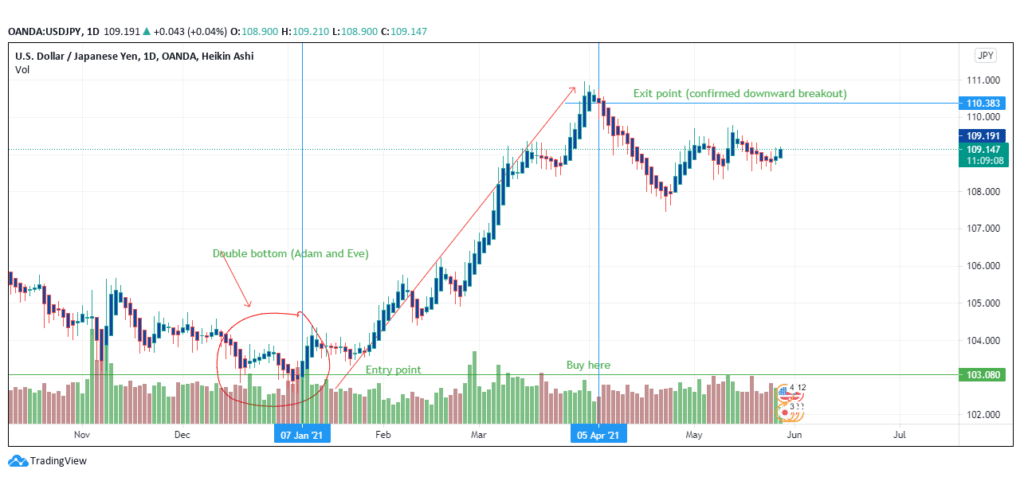
Figure 5: Double bottom pattern in the USD/JPY trading pair
In figure 5, we have established that a double bottom appeared into 2021 in the USD/JPY trading chart. The double bottom indicates a bullish reversal as it begins from a downward prior price movement.
The pattern has been confirmed since it took shape in the annual low-price move. Since it is a bullish pattern, we entered the trade by buying the pair at 103.080 on January 7, 2021. As a long-term movement, the trade continued until April 5, 2021 (3 months). The chart confirmed a downward breakout on the date as the trading price hit 110.383. We exited the trade after accumulating 730.3 pips.
A closer look at the trading chart shows that the uptrend after January 7, 2021, was not straight. The trader should check if the trendline forms a retracement or a reversal. In the case of a reversal, it is important to exit the trade before increasing risks. Further, a stop loss also helps to limit losses in case a reversal begins after entering a trade.
Fundamental analysis
Long-term trade options are also influenced by fundamental news that consists of economic, social, and political events that affect the forex market. Long-term investors need to consider this analysis before entering or exiting trade options.
Conclusion
Entry and exit options in the forex market differ for short-term and long-term traders. For short-term traders, it can be as simple as just looking at candlesticks or checking a price move and then entering the trade. For long-term investors, it requires additional analysis of the factors affecting the shape or formation of the candlesticks.

