Fibonacci Retracement Basics
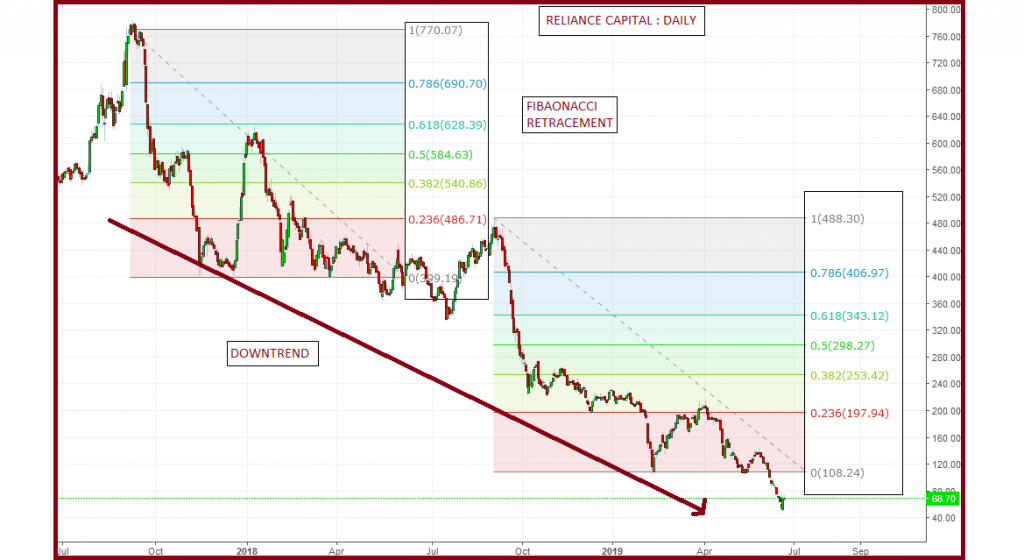
Fibonacci retracement levels are horizontal lines that indicate the area where there is a possibility of support and resistance to occur. These levels are based on Fibonacci numbers. All levels are associated with percentage according to the prior move retracement of the price. The official Fibonacci retracement levels are 23.6%, 38.2%, 61.8%, and 78.6%. 50% is not an official Fibonacci ratio, but it is also used.

The Fibonacci retracement indicator is useful because you can draw it between any two significant price points, be it high or low. After that, the indicator creates the levels between the two points. Let us assume that the price of an asset raises $10 first and then drops $2.36. In this case, the retracement is 23.6% which is a Fibonacci level. You can find the Fibonacci numbers throughout nature. Hence, most traders believe that these numbers are highly relevant in financial markets. Keep in mind that these levels do not have formulas. When you apply the indicator to a chart, you can choose two points and draw the lines at percentages of the move.
History of Fibonacci Magic
Born during the 12th century in Pisa, Leonardo Pisano, nicknamed Fibonacci is one of the most influential mathematicians in the history of the world. In his book “Liber Abaci” which means “The Book of Calculation”, he described new methods of calculations and introduced the Fibonacci Number Sequence, as well as the Golden Ratio. We can use Fibonacci’s work to describe many aspects of the world that surround us, and we can also use it in currency markets. His ratios are valid for traders. By adding Fibonacci to trading, traders can locate future targets for stops and exits and can also find accurate entry levels. If you use it correctly, then it increases your return on investment.
The most important number is the 61.8% or .618 levels. The 38.2%, 50%, 23.6%, and 78.6% are other most commonly used levels. The Fibonacci level you should choose to interact with depends on the strength of the trend you are trading with. If the trend is strong, then the trader should look for a minimum retracement, around 38.2% or 50%. However, when the trend is weak, you can choose 61.8% or 78.6%. If the price breaks the 100% mark of the prior move, then the current move would be invalid.

How Fibonacci Retracement Can Be Adjusted
To find Fibonacci retracement levels, traders must look for the recent significant swing from highs to lows. For uptrends, you need to click on the beginning of the prive movement and then drag the cursor to the most recent high. For downtrends, do just the opposite. This is how you can apply Fibonacci retracement levels for trading in the currency markets:
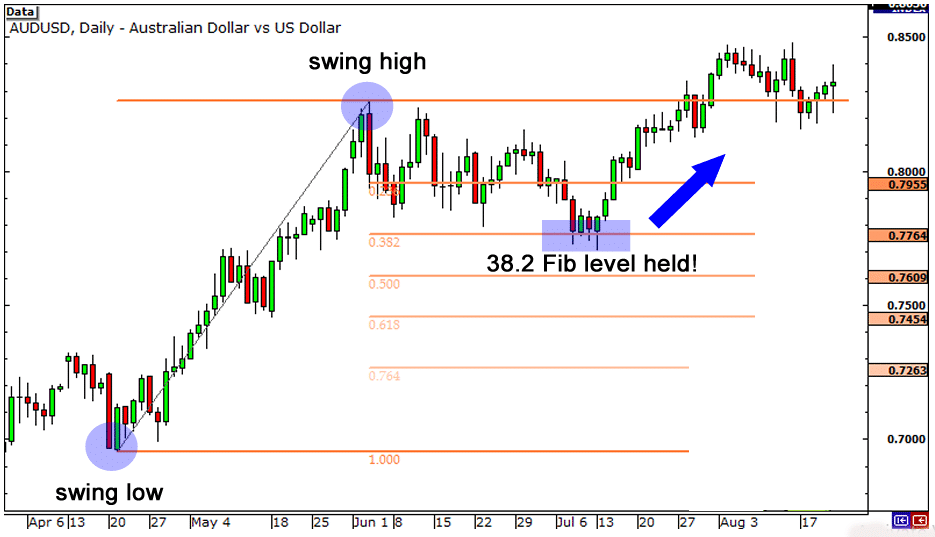
Uptrend: Assume that there is a daily chart of AUD/USD. In the chart, we clicked on the swing low at .6955 on April 20 and dragged the cursor to the swing high at .8264 on June 3. Now, the charting software displays the retracement levels.

The Fibonacci retracement levels on the chart are .7955 (23.6%), .7764 (38.2%), .7609 (50%), .7454 (61.8%), and .7263 (76.4%). Now, you can expect when AUD/USD retraces from the recent high, it would find support at one of the Fibonacci retracement levels mentioned above because traders will place buy orders at these levels when price pulls back.
With these conditions, let us see what happens after the swing high occurs. First, price pulls back through the 23.6% level and continues to shoot down during the next two weeks. It also tests the 38.2% level but cannot close below it. Later, the market resumes its upward move around July and breaks through the swing high eventually. So, it is clear that buying at the 38.2% Fibonacci level would have been a profitable long-term trade.
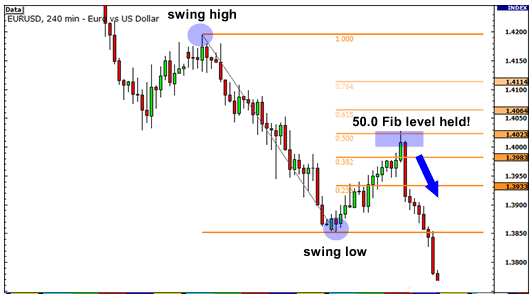
Downtrend: Now, let us assume that there is a 4-hour chart on EUR/USD. On the chart, we found the swing high at 1.4195 on January 25 and then swing low at 1.3854 on February 1.

The retracement levels on the chart are 1.3933 (23.6%), 1.3983 (38.2%), 1.4033 (50.0%), 1.4064 (61.8%) and 1.4114 (76.4%). For a downtrend, we can expect if the price retraces from this low, it possibly encounters resistance at one of the Fibonacci levels because traders that want to play downtrend at better prices may opt to sell orders there.
Now, what is the result? First, the market tries to rally, stalls below the 38.2% level for a short time before it tests the 50.0% level. If a trader has some orders on 38.2% or 50.0% levels, then he/she can make some brilliant pips on the trade. So, you can see that price finds temporary forex support or resistance at Fibonacci retracement levels. All traders who use the Fibonacci tool, experience these levels becoming self-fulfilling support and resistance levels.
Basic Strategies Using Fibonacci Retracement
Pullback Trades:
You must identify a security in a strong trend first. A strong trend is a stock that has successive highs with pullbacks of below 50%. If you are a day trader, then you need to identify this setup on a 5-minute chart. You can do it in 20 or 30 minutes after the market opens. After you have identified a strong uptrend, observe the behavior of the currency around the 38.2% and 50% retracement levels from the morning highs. You also need to keep an eye on the time and sales and level 2. The right time of entering the trade is when the trading activity slows down or turns. The most recent high or a Fibonacci extension level is a great target point for traders to exit the trade.
Breakout Trades:
Breakout trades have high failure rates, but you can take chances with this strategy by using the Fibonacci retracement indicator. First, you need to clear a Fibonacci extension level. This level implies that price has cleared the 100% retracement and pressed on. You have to find a stock that clears this level with volume. However, keep in mind that just buying the breakout is now enough. Hence, make sure when the stock approaches the breakout level, it does not retrace more than 38.2 of the prior swing.
Trading with Indicators:
Traders can use the Fibonacci retracement indicator with other indicators, such as:
- MACD + Fibonacci retracement: In this strategy, you have to try to match the moments when price interacts with the crucial Fibonacci levels while MACD identifies an entry point. You can hold the stock until you receive a crossover from the MACD in the opposite direction.
- Stochastic Oscillator + Fibonacci Retracement + Bill Williams Alligator: in this system, traders try to match bonuses of the price with oversold or overbought signals of the stochastic. When you get two signals, you can open positions. If the price starts trending in the favor of the traders, they can stay in the market if the Alligator is acting up and its lines are far from one another. When the lines of the Alligator overlap, it stops acting and traders can exit the position.
The Bottom Line
Often, Fibonacci retracement levels indicate reversal points with strange accuracy. However, they can be harder to trade than they look. It is best to use them when you are in a broader strategy. This strategy ideally looks for the confluence of various indicators for identifying potential reversal areas and offering high-potential-reward, low-risk trade entries. Fibonacci retracement is even more powerful if you use them with other technical signals or indicators.


