You can create Fibonacci retracements by using Fibonacci ratios for dividing the vertical distance into peaks and troughs. These levels help you identify areas of support and resistance where the price trend has a chance to reverse. You can use this to determine the trade entry points.
After the price has risen quite a bit, you can measure the distance between the bottom and top to determine where the price backtracks prior to rising higher and following the trend. Conversely, after the price level has sunk, you can measure the distance between the top and bottom to determine where a retracement could take place before advancing further downwards.
Fibonacci extension levels, on the other hand, let you measure how far the price can go after the conclusion of the retracement. So, while retracement levels are useful for entering a trend, extension levels indicate that the trend has ended.
Fibonacci Bollinger Bands
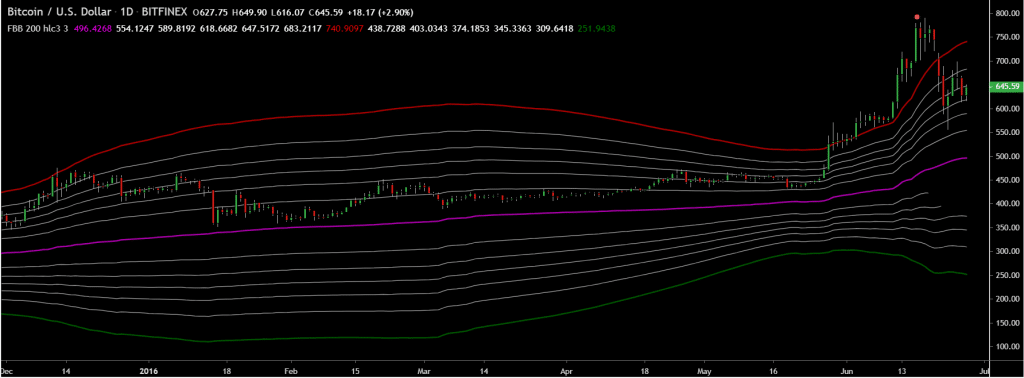
This strategy is created on the basis of three swing lows and highs. For a buy trade, this scheme points out a swing low first, followed by a swing high. After that, it identifies a swing low between these two points.
The Bollinger Bands are used to locate the first two points. Regardless of whether you are looking to buy or sell, the first two points must remain outside the bands, while the third one must remain inside them.
For a buy setup, the price must advance from a swing low to a swing high point and then retrace back to a swing low. Conversely, for a sell setup, it must move from a swing high to swing low and then retrace back to a swing high. A long position is triggered when the upward move continues to a level that’s equal to a value you get by subtracting the first point from the second, dividing the result by two, and adding it to the third point.
A short trigger is activated following the same rules, but with the first point being subtracted from the second.
Fibonacci RSI
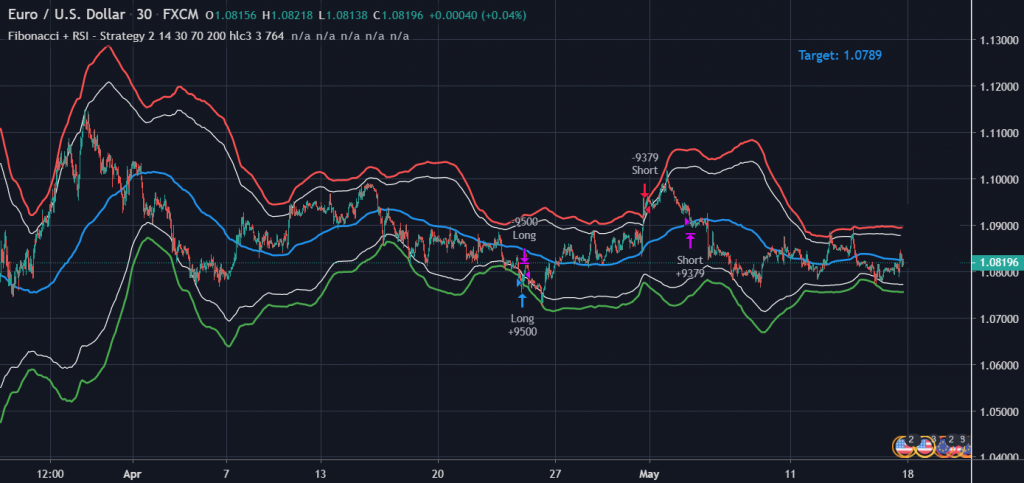
This trading strategy combines RSI and Fibonacci levels and is suitable for 30-minute, 5-minute, 15minute, and 1-minute timeframes. Here, we use the RSI (30/70) indicator and the Fibonacci (1 – 0.784) for the EUR/USD pair.
The Relative Strength Indicator indicates a divergence, which is also a downtrend signal. Divergence occurs when the indicator displays lower highs even as higher highs are made by the price. This is an indication of the momentum losing strength.
When the momentum slows into the resistance zone, it opens up trading occasions. After the 1 or -1 Fibonacci levels are hit by the price, a price rebound might occur. In that case, it should be checked if the overbought or oversold conditions are satisfied.
If the conditions are satisfied, short and long positions are triggered. The stop loss is placed above the current swing high, and the take profits are placed at a distance two times that of the stop loss. This strategy is not suitable for highly volatile markets.
Fibonacci EMA
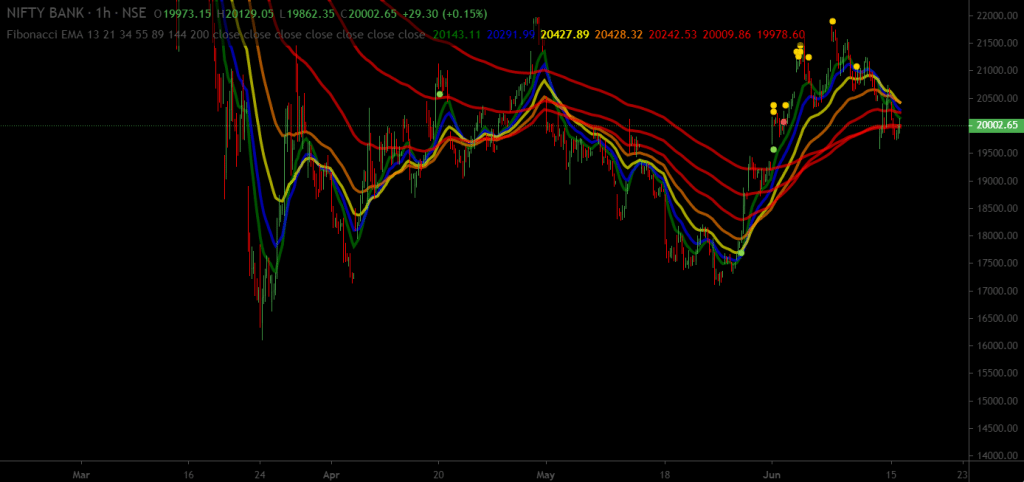
Here the Fibonacci numbers 5 and 13 are considered to be the moving average parameters. EMA 5 and EMA 13 can be used for timing entries and exits and for determining the price movement. A position should be opened when EMA 13 is crossed by EMA 5.
You should enter a long trade when EMA 5 crosses EMA 13 from underneath. Conversely, a short trade should be placed when EMA 13 is crossed by EMA 5 from the top. After the closure of the time interval, an entry ought to be made at the opening price of the subsequent candle, provided the EMAs have intersected each other.
You need to place the stop loss above or below EMA 13. An exit should be made when the closing price depicts the crossing of EMA 13 and EMA 5, and the prices reach the stop order.
Fibonacci ZigZag
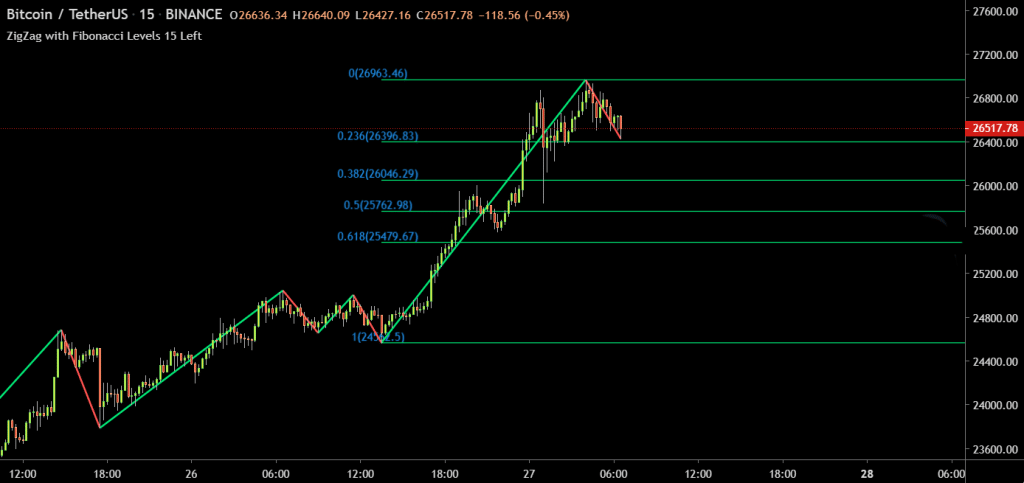
This strategy uses ZigZag to figure out whether the trend is bullish and bearish and to predict the next move. The Fibonacci levels help you identify the entry and exit points after establishing the nature of the trend.
With ZigZag, it is possible to isolate the lower bottoms, lower tops, higher bottoms, and higher tops on the chart. During an uptrend, the pair should be bought at the 38.2% Fibonacci retracement level. On the other hand, when the trend is bearish, you should sell the pair at the same retracement level.
Support and resistance with Fibonacci
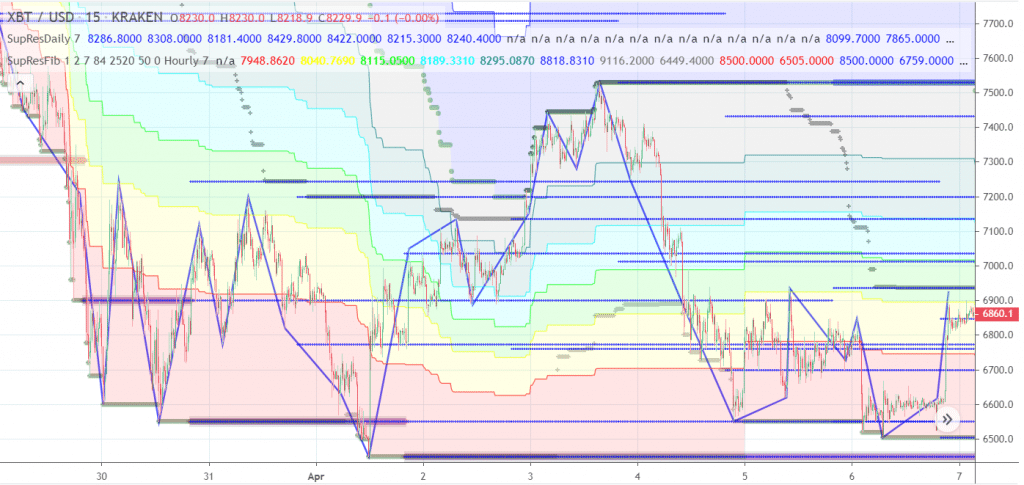
While using support and resistance areas with Fibonacci retracement, you need to stand by for the zones where they collide. For a short setup, you first need to identify a support zone and then wait for a price breakout. When this happens, you can draw a Fibonacci retracement on the break-out swing.
Then, you need to stand by for the price to return to the zone of the intersection. Confirmation will be provided by a bearish candle. You should place the stop loss on the following Fibonacci level.
A strong resistance zone needs to be identified when you are looking to enter a long trade. Then, similar to the sell setup, you have to wait for the price breakout and draw the retracement level. After the return of the price to the resistance area, you can place your trade and set the stop loss on the subsequent Fibonacci level.
Summing up
The similarities between the chart situations are as follows:
- All of them involve price retracements.
- They indicate support and resistance zones.
- They help you predict when the price levels will be tested.
- The retracement levels do not provide any assurance of the price stops.


