
Chart patterns are essential technical analysis patterns that make it easy to analyze price action and determine where it is likely to move. They come about whenever asset prices move in a defined manner resulting in a common shape that is easy to detect. Cup and handle is one structure common with currency pairs.

Understanding cup and handle
A cup and handle occur whenever price oscillates, resulting in a pattern with a ‘U’ shape and a slight downward movement at the top that appears as a handle. On the other hand, the handle acts as a small pullback after a significant move up, providing an ideal entry point.
It is considered a bullish pattern given that the ‘U’ shape signals a build-up in buying pressure, after which prices often edge higher, printing new highs. It is also considered a continuation pattern whenever it happens when the market is trending up, consequently resulting in higher prices.
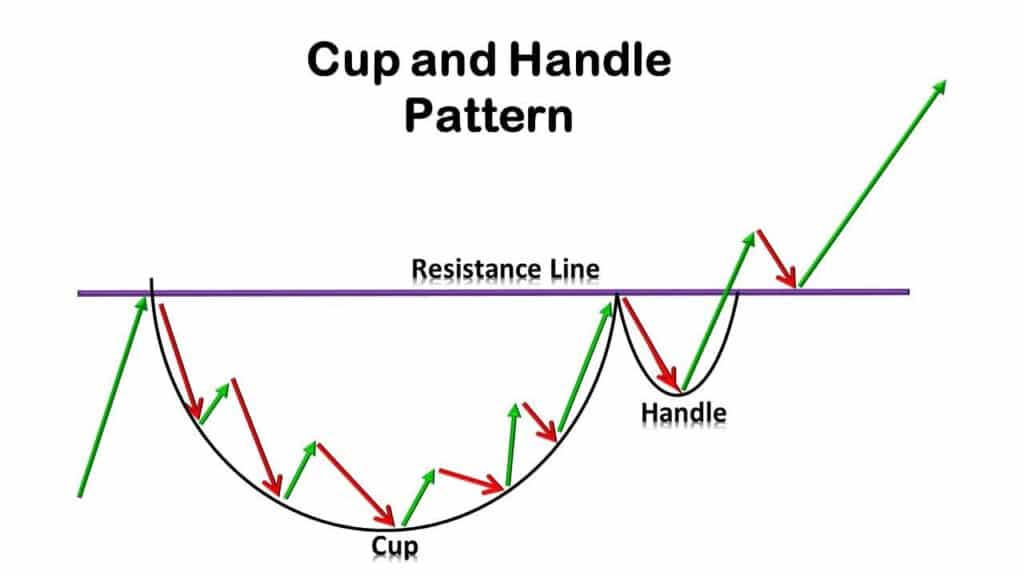
While analyzing this pattern, it is important to pay close watch to the size of the cup. A perfect cup should be of the same height on either side. However, this is not always the case. A much longer U-shaped cup signals a strong signal. Consequently, whenever a slight pullback occurs after the ‘U’ shape or cup, it is often expected that the price will bounce back and continue moving up.
The price tends to move sideways at the bottom of the cup, resulting in a round base structure. The fact that the price struggles to move below this level signals strong support. The strong support affirms the prospects of a big bounce-back once sufficient buying pressure builds up.
Tips for trading cup and handle
While it is common for a V-shaped bottom to form at the base of the cup, some traders oppose this setup as it implies the price did not stabilize before bouncing back. The prospects of price coming back to the base are usually high with a v-shaped bottom.
In addition, it is important to stay clear of overly deep handles. Such structures signal substantial selling pressure following the U shape. In this case, the price might end up falling back to the base of the cup, implying a build-up in bearish momentum.
Additionally, while studying such patterns, it is important to pay close watch to the underlying volume, especially after the formation of the cup. In this case, the volume should decline as the handle is forming. Declining volume signals waning selling pressure offering an ideal opportunity to trigger a long position. The volume should increase once the price bounces off the handle formation.
How to trade cup and handle
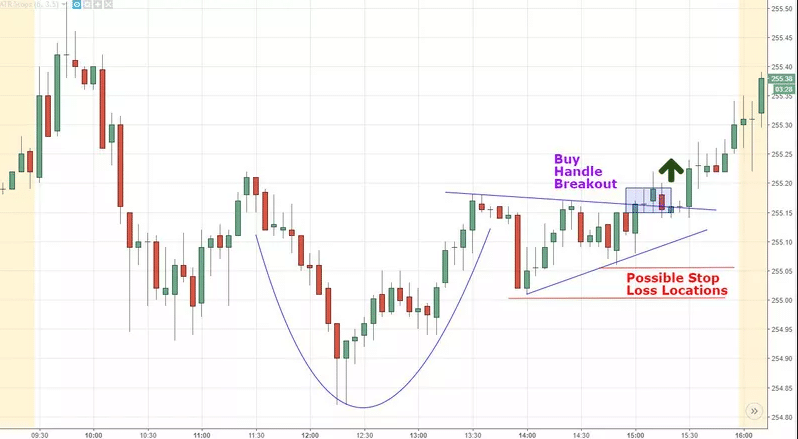
The chart below shows a cup and handle structure with a round bottom. As the price was edging higher, it reached a point of strong resistance level, at the peak of the ‘U’ shape. Exhaustion appears to have kicked in a pullback in a descending channel, which forms the handle for the setup.
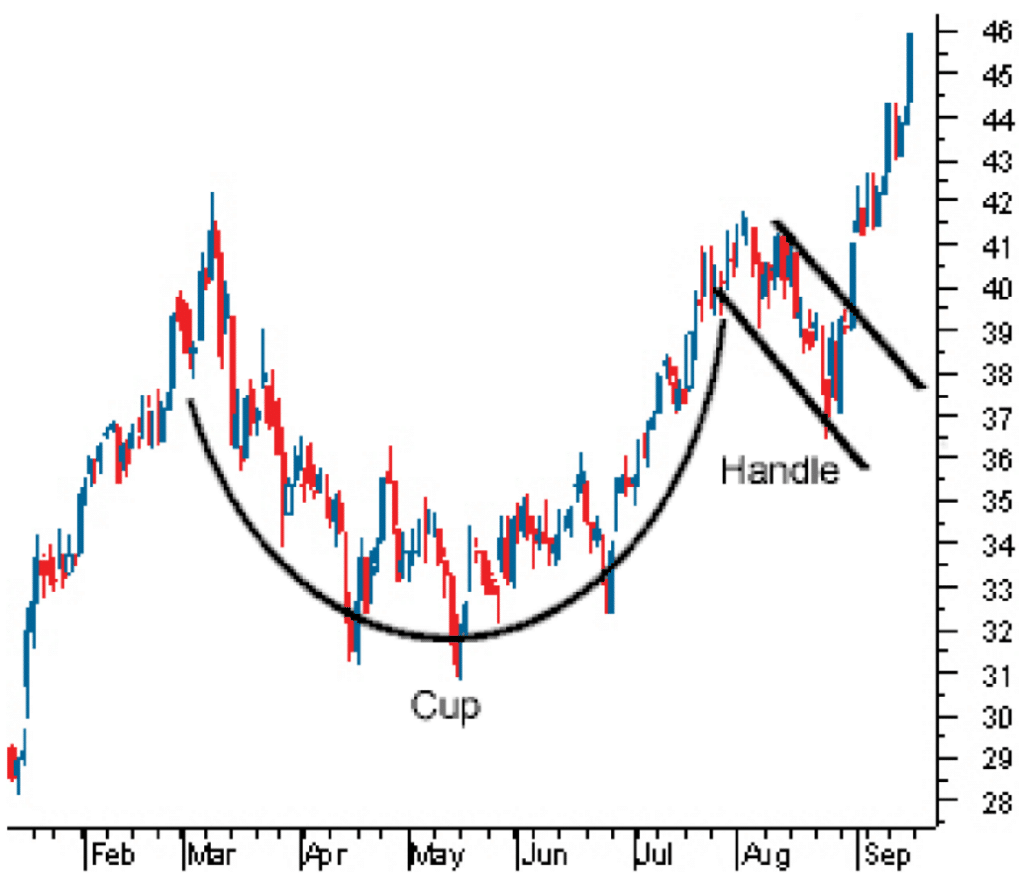
The consolidation phase did not last, given the previous strong upward momentum. Price breaking above the descending trendline of the handle signals price is poised to edge higher in continuation of the underlying uptrend.
In this case, one can look to place a buy-stop order slightly above the descending trend line to profit from the breakout. A stop-loss can be placed a few pips below the lowest level of the handle structure to shield against potential price reversals.
When to trade
There is no limitation on when the pattern can occur. It can occur in small to large timeframes. However, it is important to note that it mostly happens when the market is in a downtrend. The bounce-back that often comes into play after a significant move lower results in a U shape, after which a break out occurs.
The handle that comes into play after the U shape can be in any form, from a triangle to even a descending channel. The handle should always be small and should not drop into the lower hand of the cup.
Whenever the setup occurs after the price has significantly moved lower, it should be interpreted as a reversal pattern. The formation of the round bottom at the lowest point of the downtrend signals price has bottomed and that a rally to the upside is highly likely.
The handle is the most important aspect of the pattern as it affirms whether the price is likely to continue moving up after the consolidation. Buy positions should only be eyed when price breaks out of the handle on huge volumes.
Limitations
One of the biggest limitations of the pattern is that it can take some time to form. The ‘U’ shape pattern, which starts with price moving lower than a round bottom before a spike to the upwards, requires a lot of patience.
In addition, a shallower cup often results in reliable signals, and at times it does not. A deep cup can also result in a false signal. Therefore, it is important to be extremely cautious and deploy other technical tools for validation.
Bottom line
A cup and handle is a reliable bullish pattern for anyone looking to profit as the price is moving up. The pattern works well with a highly liquid market. One should only look to enter trades as soon as the price bounces off the handle and starts to break to the upside.
In addition, the pattern should never be relied solely on for making trading decisions. Instead, it should be used in combination with other technical analysis tools such as indicators for more reliability.

