The prediction of price movements based on past price movements, also known as technical analysis, has been known to generate significant profits despite it being incompatible with what most economists call the “efficient market”. One of the most common technical trading patterns is the Head and Shoulders (H&S) formation. It is generally considered as a reliable indicator of an impending price movement; which traders can effectively exploit.

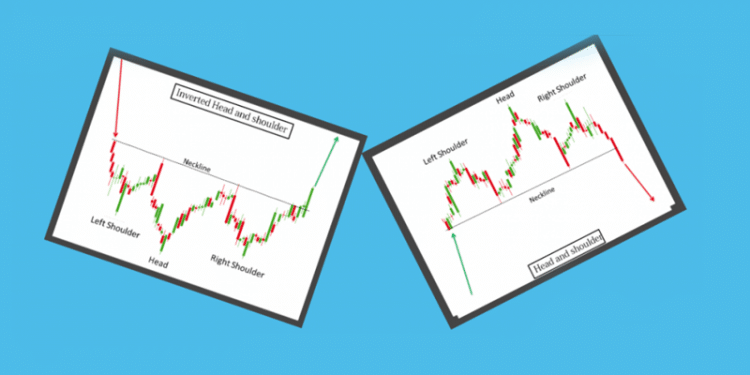
The primary characteristic of this pattern is a three-peak sequence, with the highest in the middle. The center peak is called the head while the left and right peaks are the shoulders. There is a straight-line which connects the troughs, separating the head from the right and left peaks. This is called the neckline.
To effectively use this pattern in forex trading, you can complement it by using support and resistance zones. The H&S pattern is more effective on larger timeframes (4 hours or up). For a novice, however, it is better to practice on smaller timeframes, as these trades are infrequent in nature. When using a longer-term timeframe, the trade takes a long time to finish as well.
Some Basic Features of H&S Pattern
Some of the basic features of this pattern include the following:
- The H&S pattern is a reversal pattern, and they are supposed to indicate the possibility of an earlier upward trend reversing. A proper trend reversal is not conclusively signaled until the neckline is penetrated.
- One should not enter into a position unless the price line crosses the neckline, confirming the pattern.
- This pattern is regarded as one of the most reliable of all chart patterns and is one of the most commonly occurring reversal patterns.
- It is not uncommon for the price line to pull back to the neckline after crossing it, before briefly continuing on its new trend.
- These patterns can occur at peaks as well as at troughs, where they are” tops” and “bottoms”, respectively. All the price factors applicable to the H&S top’s pattern apply equally to H&S bottoms, albeit with a significant change.
Entering the Trade
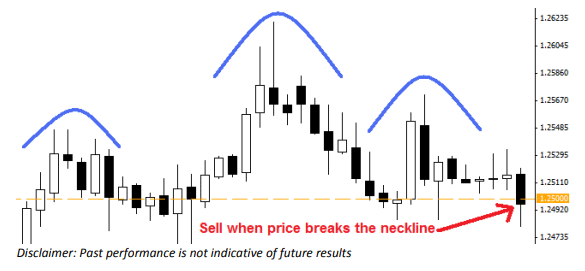
When prices start trading below the neckline, which in this case will also be the support and resistance zone, the first entry for this formation is to sell. In other words, you should sell on the open of the candle and follow that candle which closes below the neckline. This is also known as the S/R line of the formation. Thus, always remember, when trading the H&S pattern, the support/resistance zone will be the neckline.
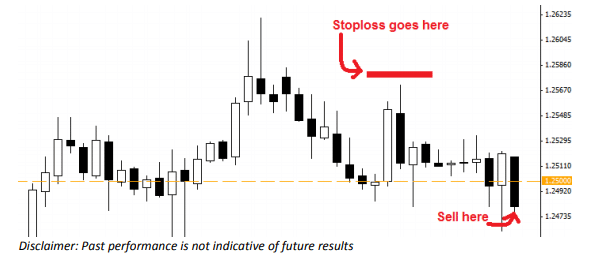
There is another way to enter a trade using this pattern. You can decide to wait for the market to break with more conviction, instead of just selling on the first break. Just wait for the price to break the neckline for a second time, before entering your trade. Look for the open of the candle that follows the second candle which closes below the neckline. Place a stop loss a little above the last shoulder formation.
You should note that the head and shoulders formations are not always flat and can often be at a slope. Even with sloped head and shoulders formations, you can find valid entry signals in conjunction to support and resistance lines.
Exiting the Trade
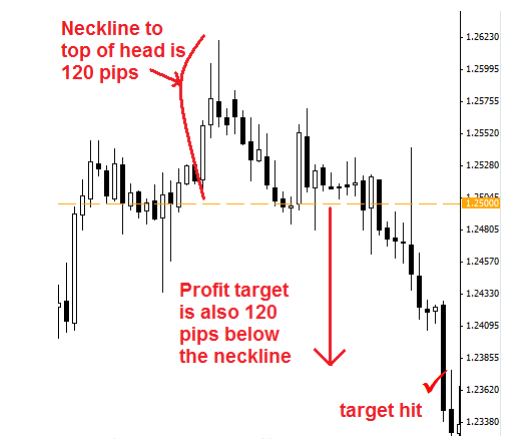
Exiting from a head and shoulders trade is simple. Start off by calculating the difference in pips from the neckline to the top of the head. The resultant number will be your profit target. However, you have to keep in mind, a few things. No single trade should be risking more than five percent of your account on any trade. For instance, if your stop loss is set at 100 pips, your trade size will be $50000 or 5 mini lots. It is generally agreed that risking 2-3% of your trading account on each trade is ideal.
Examples of Head and Shoulders Patterns in Forex
Example #1
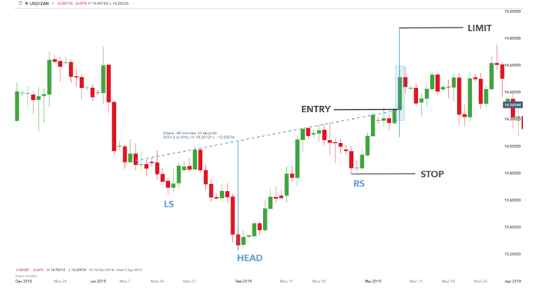
Here, the USD/ZAR currency pair and shows an inverse H&S pattern. It mostly asymmetrical in nature, with the neckline, which is slightly skewed while still maintaining the pattern’s integrity. The price candle closes above the neckline or the neckline break indicates the long entry-level here. The limit distance can be found out by measuring the distance from the “head” low to the neckline. The stop distance is derived from the low from the right shoulder.
Example #2
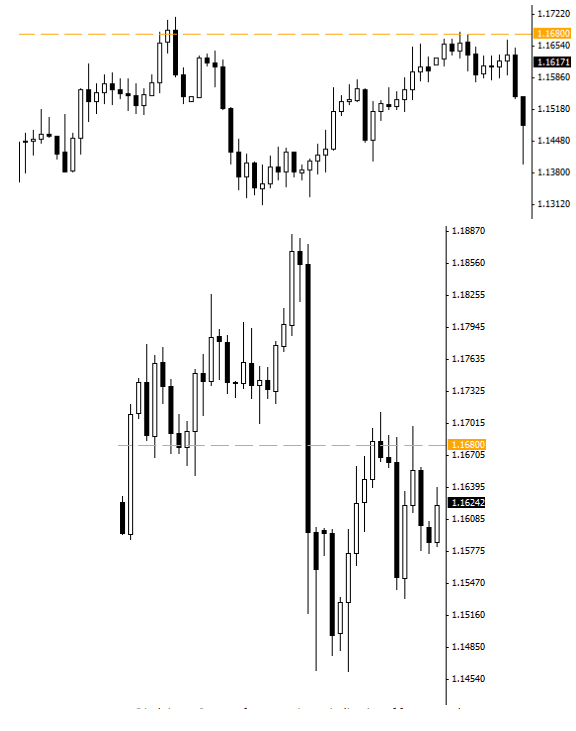
This chart shows the formation of an H&S pattern on the USD/CHF chart. It is a 4-hour chart in which the 1.1680 price shows many of the qualities associated with support and resistance zones. It is a valid zone as the pair repeatedly fund resistance at this level. The 1.1680 level gives support as well as more resistance to the USD/CHF later on as well.
Example #3
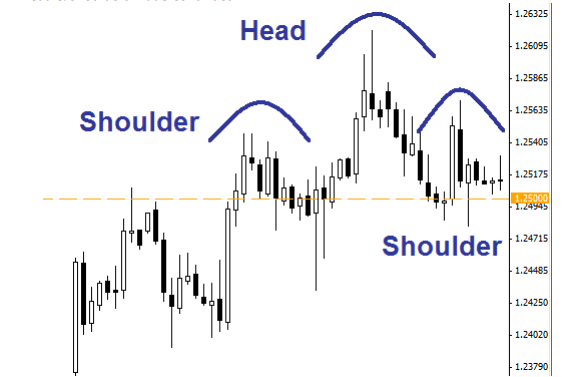
In this case, the head and shoulders pattern forms right on the 1.2500 support and resistance zone. Combining the head and shoulders formation with a strong support and resistance line will provide you with an exceptional setup for forex trade.
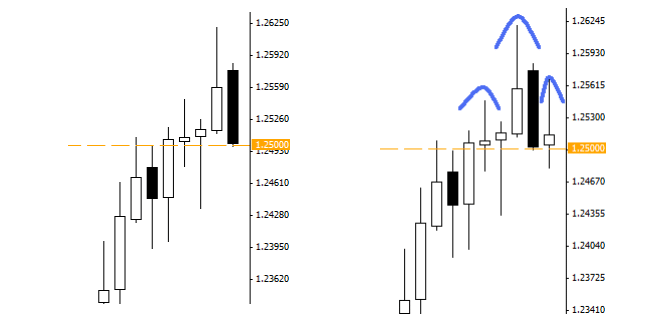
When we switch to a larger timeframe such as the daily chart, we will see that the formation has forced the price through the support /resistance zone. However, it later shows weakness and retreats back towards the neckline. When falling back towards the zone of resistance, the price makes an upward bounce, creating the last part of the head and shoulders pattern that we see here. Once we see that the formation is on a support and resistance zone, traders can easily decide when to enter the trade as discussed above.
Final Thoughts
When using the H&S pattern you should always use proper reward risk ratio to maximize the effectiveness of the trade from a risk management perspective. The H&S pattern makes it easier to exploit big market movements in the forex as well as in other markets. Although the risk-reward ratios may not be always favorable, it provides us with defined risk and take profit levels while trading.

