Heikin Ashi Candlesticks Explanation and Calculation
The Heikin Ashi is a type of trading chart, originally from Japan, which is generally used in conjunction with candlestick charts to spot trends in the market for the prediction of future prices. Traders and analysts mainly use the Heikin-Ashi for the easy analysis of trends, as well as to make candlesticks more readable. For instance, identifying trends is an essential part of generating profits, and the Heikin-Ashi charts can let traders know when to get out during trend pauses or reverses, or when to stay when the trend persists.
While trading, many want some additional confirmation for the direction of the trend. Traders use the Heikin-Ashi chart as a technical indicator on a standard candlestick chart. This helps in highlighting and clarifying the current trend. Investors and swing traders can use the Heikin-Ashi independently.
The Heikin-Ashi charting technique has some similar characteristics with a regular candlestick. A normal candlestick consists of 4 separate pieces of price data in a visual form, which include Open, Close, High, Low(OCHL). The Heikin-Ashi uses a modified form of the above formula, which is as follows.
COHL (Close-Open-High-Low)
- Close: It is the average of the current period’s open, high, low, and close prices.
- Open: It is the average of the Previous open of the Heikin-Ashi plus the close price of the previous Heikin-Ashi candlestick.
- High: It is the maximum of three data points(prices):
- The high of the current period
- The current open of the Heikin-Ashi
- The current close of the Heikin-Ashi
- Low: It is the minimum of three data points:
- The low of the current period
- The current open of the Heikin-Ashi
- The current close of the Heikin-Ashi
Heikin Ashi vs. Regular Candles
Regular Candlesticks and Heikin-Ashi share a lot of the same characteristics but have some pronounced differences. Both are constructed the same way, but the formula for calculating each of the bars is different. The user defines the time series depending on what type of chart they desire, such as five minutes, hourly, or daily. Filled candles represent the down days, while empty candles represent the up days.

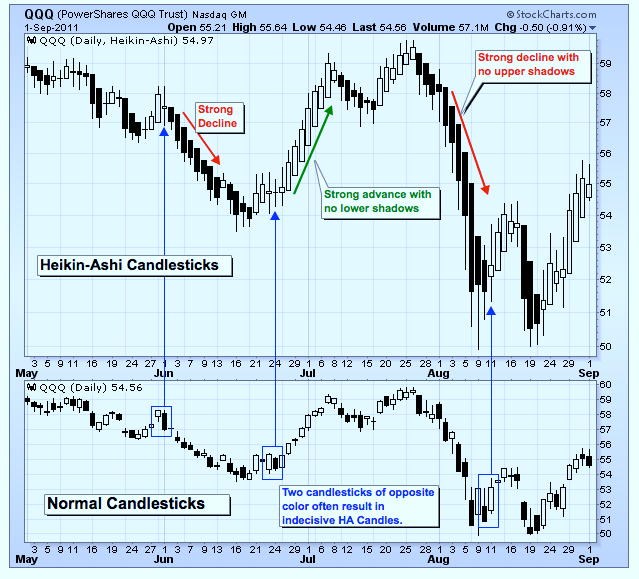
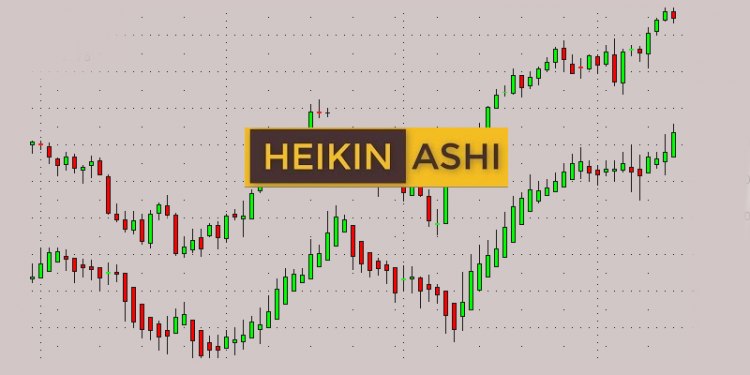
These are both a Heikin-Ashi and a normal candlestick, over four months. One of the significant differences between the two charts is that the Heikin–Ashi has a smoother look. This is because it takes an average of the movement. Heikin-Ashi’s tend to stay green when there is an uptrend and red when there is a downtrend. Normal candlesticks, on the other hand, alternate color, regardless of whether the price is dominantly moving in a single direction.
Heikin Ashi Trading Tips
Just like other charts, traders can use the Heikin-Ashi to trade setups, or patterns such as wedges and triangles. Compared to a normal candlestick, a Heikin-Ashi’s entry and exit points can vary. This is because the price on the chart is very different than that of the candlestick.
Traders can apply Heikin-Ashi to any market, with most charting platforms, including it as an option. For identifying trends and buying opportunities, there are five primary signals that one needs to know of.
- Green candles that have low lower shadows are an indication of a strong uptrend. Traders can let their profits grow.
- Green candles indicate an uptrend. Market bears might want to cover their positions, and bulls can expand their longs.
- As with regular candles, Heikin Ashi, with significant upper and lower shadows and a small body, is often a trend changing signal. While conservative traders might want to wait for confirmation at this point, before going short or long, more risk-loving traders may attempt to trade reversal at this point.
- Red candles without upper shadows indicate clear bearish sentiment in market prices. Until the trend changes, traders should avoid buying. Keeping short positions is the case.
Traders can quickly locate trading opportunities by identifying trends using these signals in comparison to normal candlesticks. They can easily spot trends as they aren’t interrupted by false signals as often.

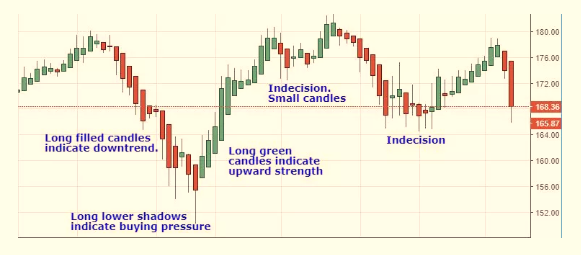
This is how one can use Heikin-Ashi charts for analyzing and making profitable decisions. There are red, long candles on the left. The lower wicks are small at the start of the decline. The lower wicks get longer as the price continues to drop. This indicates that the price pushed back up after initially dropping. This builds up buying pressure, after which a strong move occurs to the upside.
The Conclusion
The Heikin-Ashi chart provides traders with a clear view of a trend, which makes them quite preferable. These charts help isolate the trend better and are less choppy compared to normal candlesticks. However, they provide less precise pricing compared to them. Ultimately a trader should first test their strategies using Heikin-Ashi charts before they risk any real funds in a live market environment.


