
Volume in forex trading is an important tool for analyzing price movements. Volume represents the size of market participants’ transactions behind certain price movements. This can shed light on the strength or weakness of said price movements. The combination of price and volume analysis provides a true picture of the pairs, revealing what others are doing and thinking. It also assists in the comprehension of market psychology.

What is a horizontal volume indicator?
A horizontal volume indicator is a charting tool that shows transaction activity over time and at a specific price level. The tool constructs a histogram to illustrate the most important price levels depending on volume. The indicator splits total volume transacted at a certain price level during a specific time period into buy and sell volume and then shows the trader the results.
The chart illustrates horizontal volumes on a level scale. One can use the chart to discover the price at which the most transactions were done by market players. The longest bar in the indicator represents the strongest and most significant level.
Horizontal volume indicator analysis
The indicator can be used to show the accumulation and distribution phase in a forex pair.
Accumulation phase
The indicator reflects price movement within a small trading range. Market sellers and purchasers engage in multi-directional trades while waiting for the trend to develop. When a large participant notices a clear predominance of orders to one side, the accumulation phase is considered complete. For example, if 80% of traders trade up and 20% trade down in a forex pair, the accumulation stage is complete.
Distribution phase
If the majority of traders have opened buy positions, a large player must move the price lower to profit. A sharp downtrend begins in this situation, and the majority of participants close at a loss. After that, the market returns to the accumulation phase, where it waits for a new buyer-to-seller ratio to emerge.
Values used in horizontal volume indicator
- Point of Control (POC): The area of the chart with the most traded volume activity is known as the POC. This is the most significant area to monitor since it allows traders to determine where they want to place their stops or find the greatest entry levels on the chart. It is used by forex traders as a retest. It can also be utilized as a point of resistance or support.
- High Volume Nodes (HVN): These are high-activity chart sub-sequences. This is a significant area that indicates an increase in trade activity.
- Value Area (VA): This is the price range in which a specific percentage of total volume was transacted.
How horizontal volume indicator is used in forex
To identify support and resistance
Both of these levels are usually characterized by strong trade volumes. You may observe a long volume bar on the histogram as you reach the top of the volume profile, with the majority of the volume transacted on the sell-side. At that price point, such a bar indicates a resistance level.
As you get closer to the bottom of the profile, you may notice a long bar, but this time the volume is heavily stacked on the purchase side. This indicates that the pair found support at that price point multiple times.
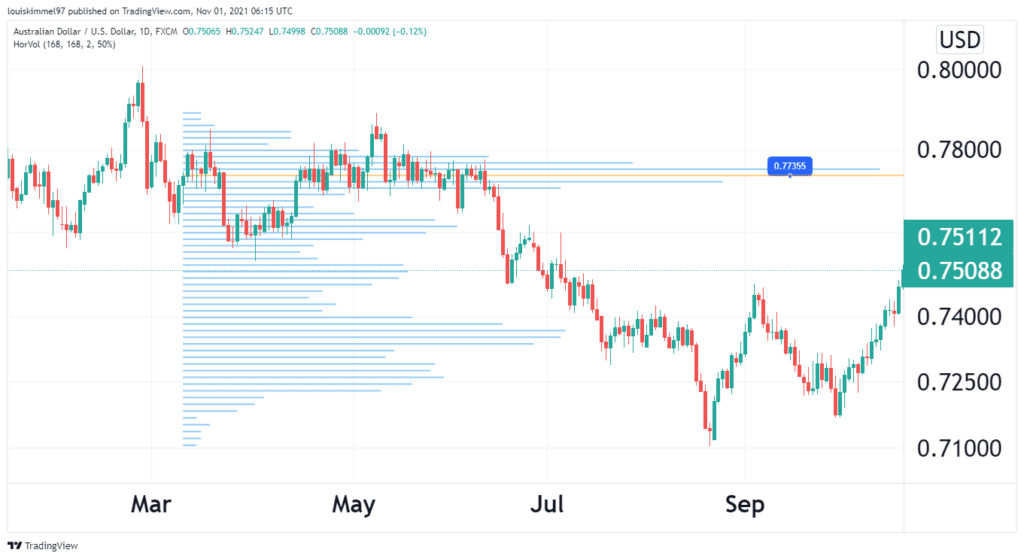
In the AUDUSD chart above the line, 0.77755 is the resistance level.
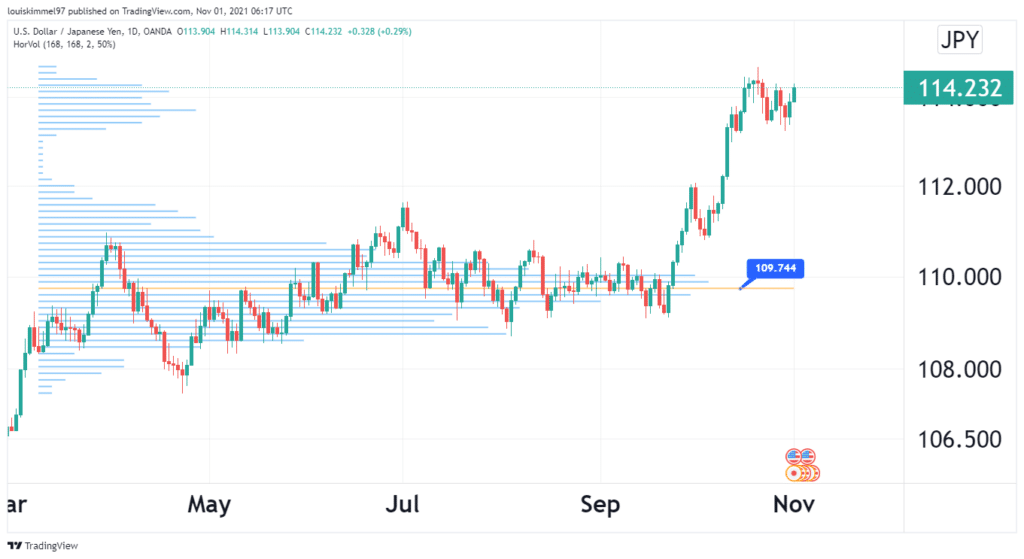
In the USDJPY chart above, 109.744 is the support level.
To identify volume nodes
High volume nodes
Volume peaks that occur at or near a given price level are known as High Volume Nodes (HVN). They could be interpreted as a sign of a stage of consolidation. There is frequently a lot of activity on both the buy and sell sides, and the market stays at that price level for a long time as compared to other levels in the profile.
Low volume nodes
Volume valleys occur at or near a price level. Low-volume nodes are common after a breakout rally or a breakdown.
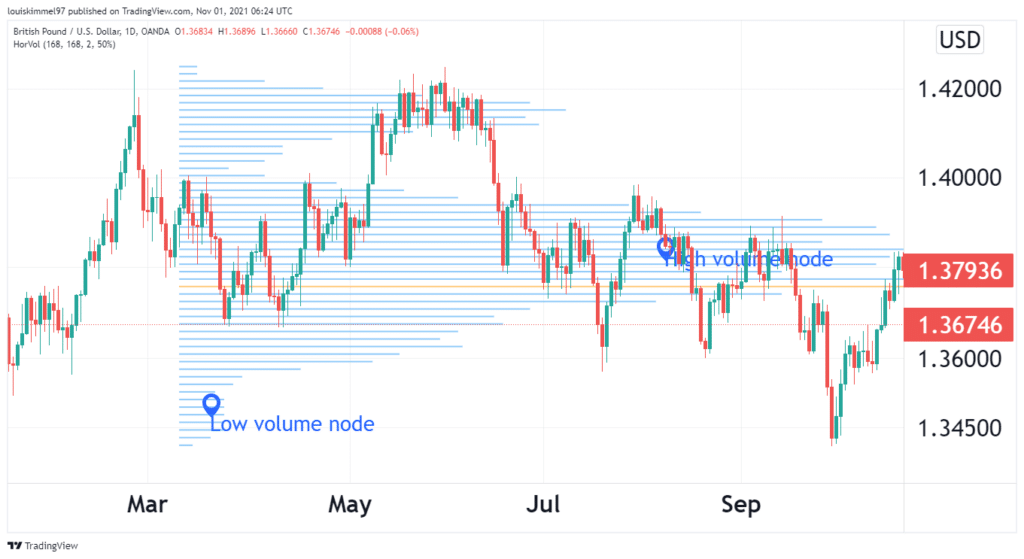
The chart above portrays the price reversals in the areas of low volume nodes.
Advantages of using horizontal volume indicator
- It gives a stronger understanding of the market as well as a visual appraisal of its current situation.
- One can correctly determine the levels of support and resistance.
- For each transaction, a preliminary risk assessment is performed, as well as precise stop placement — precisely outside the Value Area boundaries.
- A limit order is a well-considered entrance point into the market.
- A fundamental and transparent trading system, as well as objective identification of personal competitive advantages, are both provided.
- Profitability and risk ratios are calculated easily: if the Value Area is divided into eight octants, the risk is one octant, and profitability is three octants.
Disadvantages of using horizontal volume indicator
- Occasionally, the price does not reach the control levels.
- Because of the long hold time, positional trading is not for everyone.
Misconceptions about horizontal volume indicator
Most traders assume that it can only be used to analyze 30 minutes at a time when trading forex pairs. This is not true because it can be used for longer hours.
The present time period’s distribution has a significant impact on the next time period. According to Donald L. Jones, a major contributor to the indicator’s development, the previous day’s distribution has no bearing on the next day.
Conclusion
Any trader can use the horizontal volume indicator to assess the market context and maintain track of the never-ending auction process. At the end of the day, a market is a perpetual negotiating process to establish equilibrium (via the accumulation of transactions at a given level), and the ones that were thought to be too cheap or too costly are those that didn’t record high volumes. This indicator can be used to identify support and resistance, as well as high and low volume nodes.

