Introduction
Descending scallop is a price pattern that looks like a reversed J-shape. This formation can be used to illustrate both upward and downward breakouts. In the case of an upward breakout, it mostly indicates a reversal as opposed to a continuation. The pattern performs better when spotted near the yearly low due to the throwback of the price and the availability of the gap in the trendline. In this article, we will look at the application of the descending scallop in a downward breakout. For this case, the pattern will best work as a continuation as opposed to a reversal.
Descending scallops are traded as bearish patterns due to the predominance of the downward price trend. The saucer-like bottom part provides the resistance as the price continues to trade below it. We might find some upward retracements leading to two or more scallop formations. However, the descending scallops will still show up in a declining trendline. They get narrower and shorter as prices continue to decrease.
There are special situations where the scallops act as reversals of the price trend.
Identification

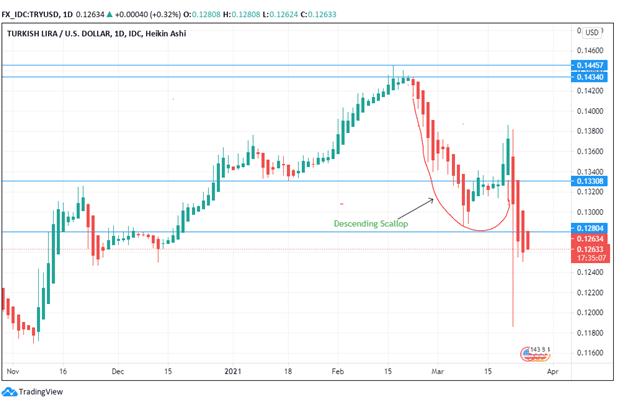
Figure 1: Analysis of Turkish Lira against the US Dollar
1. Prior Price trend
The formation of the descending scallops mostly appears in a downward price movement. Figure 1, shows that the scallop has begun descending at 0.14340 after hitting a high of 0.14457. The scallop descends until the price movement hits 0.12804.

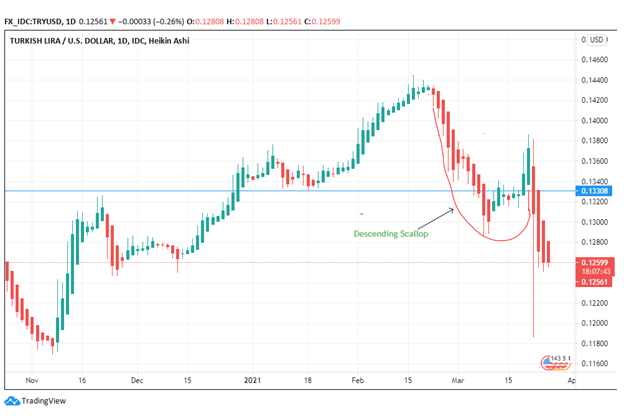
Figure 2: Price movement of the TRY/USD
Price breaks out downwards, and the scallop acts as a reversal at this stage. The trader should adopt a selling position as the pattern develops. There is an upward retracement where the scallop bottoms down. However, the price adopts a continuation bearish pattern. It descends to 0.12633, with the trade pattern showing the Turkish lira will continue losing against the dollar.
2. Reverse shape
The descending scallop is featured by a reverse J-shape pattern that begins from the left side and bottoms before rising to a weak right retracement. This corrective phase takes the form of a bowl shape. It is smooth and rounded. The trader will observe that the bottom round pattern of the scallop is not V-shaped. However, there is an increase in volume, as denoted by the rising green bars that are wide as the retracement continues. They are replaced by stronger green bars that indicate that prices will continue decreasing in the long-term.
3. Price variations at the two scallop ends

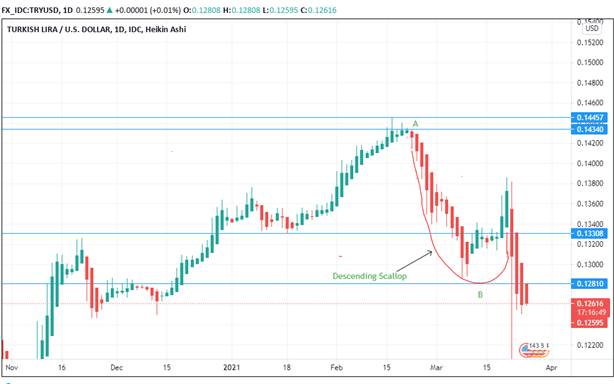
Figure 3: End-to-end price variation of the TRY/USD pair
Figure 3 shows two points of the scallop marked A and B. Part A is the beginning of the descending scallop while part B forms the end-rounded bottom section. The price at part A is 0.14340, while the price at part B is 0.12810. The price variation between these two ends is 10.67%. This variation is significant as it shows the pattern movement is sufficient to predict price movement more than 10% below the price target. This information is crucial to a trader as he plans the short position.
4. The volume of the breakout
If the volume of the breakout is dome-shaped, it will work well in an upward breakout. A dome-shaped bottom volume indicates that the reversal may not be sustainable. In the case of the downward breakout, a U-shaped pattern will steer and propel the price movement on the downside.
In the case of Figure 3, the bottom part of the descending scallop is U-shaped. Since the figure illustrates a downward breakout, the U-shaped pattern will support the downside movement of price for a lengthy period. The trader can expect the price to move lower due to the U-shaped pattern of the scallop.
Trading strategy
1. Target price computation
Compute the target price by first getting the scallop’s height as well as the bottom’s height.

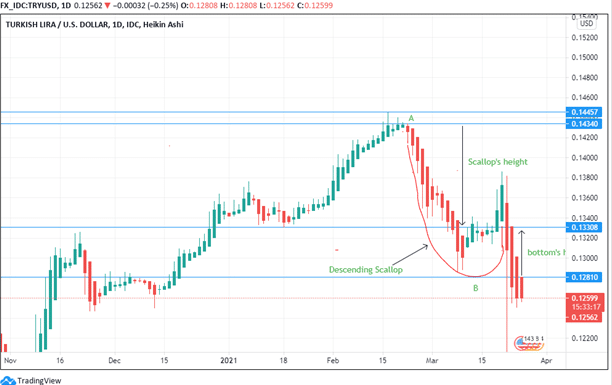
Figure 4: Target Price Computation
The height of the descending scallop is first calculated by subtracting the beginning area of the descent with the breakout position. The positions are calculated as follows:
Scallop’s height – 0.14340- 0.13308 = 0.01032
Bottom’s height – 0.13308 – 0.12810 = 0.00498
Get the scallop’s height- bottom’s height = 0.01032-0.00498 = 0.00534
If this was an upward breakout, we could add the figure 0.00534 with 0.13308 to get 0.13842 as the new bullish target price. However, since the example shown represents a downward breakout, to get the target price, we will have to subtract 0.12810 with 0.00534 to get 0.12276. We are using 0.12810 since it is the bottom price movement trendline that is acting as the resistance point at the scallop.
2. Breakout
We are using 0.12810 since it is below 0.13308 – the confirmation line where prices of the TRY/USD pair close below the lowest low of the descending scallop. It helps the trader confirm that the pair is trading in a downward breakout and also how to plan the short.
3. Stop-loss
Place the stop loss below the lowest position in the scallop in the case of an upward breakout. In the case of a downward breakout (as shown in figure 4), since the TRY/USD pair has a downward breakout, then we will place the stop loss above 1.4000 to ensure that we reap benefits in case the short sell position is outlived by the pattern.
Further, this example represents a bear market. The trader will be assured of maximum returns if he sells rather than buys the stock. The market trend should guide the trading strategy as well as strengthen the pattern interpreted.
Conclusion
Sharp and tall descending scallops have a high efficacy in defining the bear market. They differ from ascending scallops due to the reverse J-shape pattern. Further, descending scallops work best in defining downward breakouts, while ascending scallops are used in explaining upward breakouts. The trader should compute the target price using the scallop and the bottom’s height. Place the stop-loss above the confirmation line for downward breakouts. The stop-loss is placed below the confirmation line for upward breakouts. The trader should also be guided by market trends as he chooses his trade pattern.


