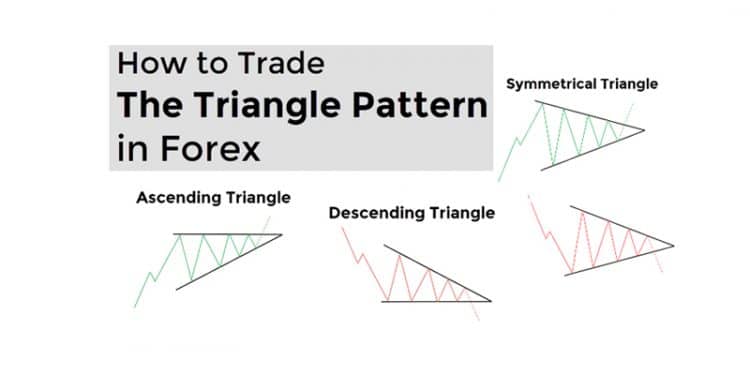
Seasoned players in the Forex market use triangle chart patterns because they depict decreasing volatility with an indication that they could expand once more. They allow traders to analyze the present market conditions and signal imminent conditions. Both during its formation and after its completion, the triangle chart pattern designates trading occasions.
What is the Triangle Chart Pattern?
It is a price chart figure that forms the moment when the price action’s peaks and troughs approach each other in a fashion similar to a triangle’s edges. Upon the intersection of the triangle’s low and high, you can anticipate a breakout. Merchants who like to trade on breakouts often use this chart pattern to identify entry points.
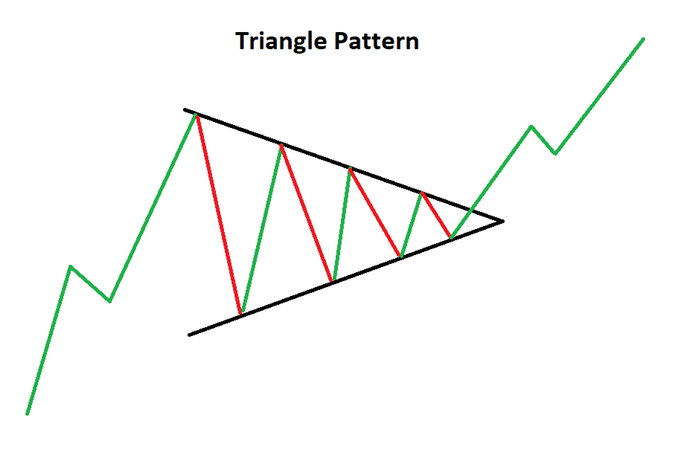
There are three different types of triangle chart patterns. Let us now discuss the trading strategies involving these.
Trading Strategies
Here are the different trading strategies using triangle patterns:
- Symmetrical Triangle
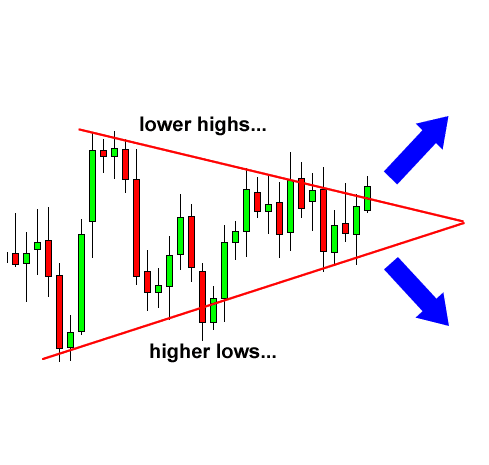
Here the market is characterized by higher lows and lower highs. Essentially, this indicates that the price is not being pushed enough by the sellers or buyers in order to form an authentic trend. Since the price cannot be pushed, consolidation takes place, and as the two edges approach each other, it indicates the imminent arrival of a breakout.
Although the direction of the breakout cannot be predicted, the occurrence of the breakout itself is without question. Traders can avail of this situation by placing entry orders beneath the higher lows edge and above the lower highs edge. As the breakout is close at hand, traders can move in the direction of the market, no matter what it is.
- Breakout Strategy
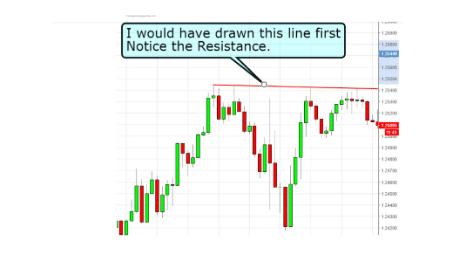
It is vital to point out the area from which the price action bounces off, i.e., whether it is resistance or support.
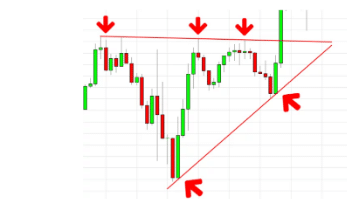
Let us look at an example of a decent triangle pattern. The above figure shows three arrows on the upper horizontal edge that point to resistance. You can also see the higher lows that lie at the base. Now, this is after the formation of the triangle, so we need to look at how it was previously.
After this, the pattern looks something like below:
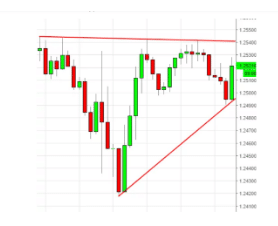
Inside the triangle, the price variance diminishes gradually, indicating the pressure building up. When one of the areas breaks, the price will follow its direction. The stop order placement should be done extremely carefully since the prices will often go down a bit after the breakage of the resistance or support level.
- Ascending Triangle
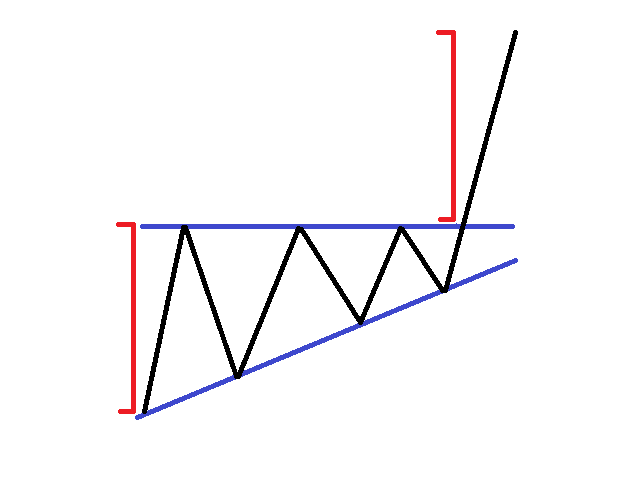
This consists of a flat upper edge and an ascending lower edge. Thus, the triangle’s tops lie at the same level while the bottoms keep rising. This pattern normally possesses a bullish nature.
Upon spotting this pattern, an upward movement in the price should be anticipated. Upper-level breakouts provide the perfect occasion for setting long entry points.
This pattern follows an uptrend that already exists with the triangle being created through the consolidation period. The vertical distance can be measured by Forex investors and utilized at the breakout to predict the level for taking a profit.
- Descending Triangle
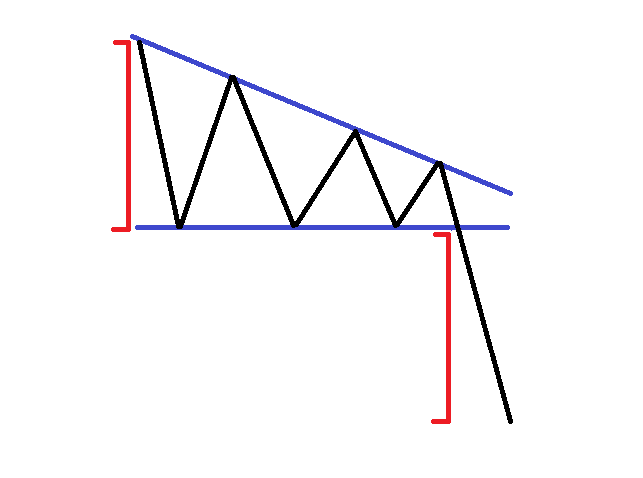
Descending triangles are contrasting images of ascending triangles. Therefore, their characteristics are exactly the opposite. This triangle’s flat side lies beneath the price action while the top side slopes downwards.
When the market is trending down, this triangle’s bearish potential has a minimum size that equals the pattern size. Thus, several Forex traders use this pattern for opening short positions following the breakage of the flat side by the price. A downward trend is expected to persist when this triangle is created while the price is tending to go down.
In this regard, you should keep in mind that both descending and ascending triangles are prone to inclined level breakage. This can get you trapped through the formation of false signals, so the breakout must be confirmed by the closure of the candle. The misleading signals can be greatly reduced this way.
Advantages
The advantages of triangle chart patterns are as follows:
- Even novice traders can easily locate these patterns on the chart.
- It is quite simple to draw these patterns, and they do not require much technical know-how.
- Interpreting these patterns does not necessitate the usage of technical indicators.
- We can get everything that we need for a trading framework through triangle patterns, including taking profit, stop loss, and entry points.
- These patterns appear more frequently in comparison to other formations related to technical analysis.
Risk Management
Stop-losses must be used along with triangle patterns. Although the price movement might seem favorable, a reversal can occur without warning, and you can control a large part of the risk by using a stop-loss. Even if the price of the security does not advance as anticipated, you can exit a trade without incurring large losses if you have a stop-loss in place.
When you have a stop-loss, you can choose the perfect size for your position. This determines how many lots you can take. You need to figure out what amount of your capital you can afford to lose before you determine the perfect size for your position.
As a general rule, expert Forex traders do not risk more than 1% of their capital on a single trade. After determining the risk percentage, you can calculate the per share risk by subtracting the stop-loss from the entry point. You can then compute the number of shares by dividing the per trade risk amount by the per-share risk.
Summary
When triangle patterns appear in the market, you should know how to make sense of them. Although they can be seen quite frequently, you won’t see them every day. If you wish to find out whether you can make profits using these patterns, you should try them out with a demo account first.

