Trading is a psychological game. When the price drops, there are more uncertainties. People tend to feel scared and want to sell to cut their losses. This will plummet the price even more. It becomes a self-perpetuating cycle.
Conversely, if prices are soaring, traders will tend to have FOMO. They will buy more, causing the price to rise even more. Again, the same cycle. When do these cycles stop? When should you close your position, buy or sell some of your assets?
In this article, we will introduce you to a tool that will help you make decisions based more on reason rather than emotions: support and resistance levels.
What are support and resistance levels?
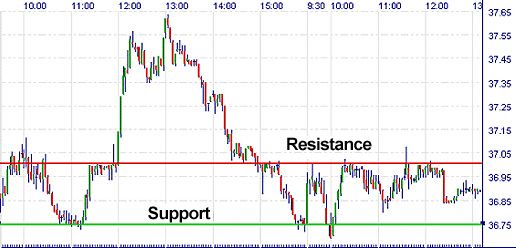
When prices are dropping, the support level is the price that the market is unlikely to exceed. A fall in price will make people worry, but they will also incentivize new investors or people who want to accumulate their assets to join. This increase in the demand creates the support line. We can expect to see a reversal of the downtrend at this point. This is a good entry point for many and a good price to open a long position.
Resistance levels are the opposite of support levels. It occurs in a booming market where prices are increasing. There will be people who want to cash in or take profits which creates a resistance that stops the price from increasing more. This is where we see a reversal of the uptrend. It is a good price to open a short position or exit the market.
How to identify the support and resistance levels?
Support and resistance levels can be determined by drawing a horizontal line across the lowest points for the former and the highest points for the latter.

We want to identify the highest and lowest prices in recent times. This reflects market sentiment and a pattern that many people subconsciously create through their emotional decision-making in the market.
How likely will the support/resistance level be broken?
You can also predict whether the support and resistance level will be broken. Intuitively, the trend and pattern will not repeat indefinitely. Therefore, if the levels have been tested for an extended period, it is likely that they will be broken in the near future.
On the other hand, the more time it touches a support/resistance zone, traders will realize the phenomenon and base their trading decisions on these zones, making the prices more significant.
You can determine whether it will break the levels based on how fast the price is reaching that level. If there is a steep slope in the change of prices, there are probably other factors affecting the general market sentiment. A faster change in price also causes more panic, which leads to uncertainty or FOMO, accelerating the change and giving it a more driving force to break through the barrier.
A natural support/resistance level is built upon a human’s rational decision (supposing all things are held constant). Our decisions can be affected by external pressures. Therefore, it is important to keep an eye on the news and the different factors that may affect participants’ behavior.
If the conditions are similar to previous times, it is likely that the level will stay unchanged, whereas if something has happened, the support/resistance level is likely to be broken or move to other prices.
Effects of volume on the strength of support/resistance levels
The strength of a support/resistance level is dependent on how much volume is traded at a certain price. More buying and selling activity at a price will make this level stronger. More activity means that the market sees this as a ‘controversial’ zone where there is an opposing view about where the market is heading. This will slow down any downward or upward momentum.
Round number phenomenon
Humans tend to mark round numbers as an end to something old and the start of a new beginning. We divide years into decades and centuries, which is 10 and 100 years instead of some other number. The same phenomenon happens with critical levels. Since a large number of people make emotional decisions during trades – especially novice traders, they will create a strong buying or selling pressure at these points which creates a layer of support or resistance.
Final remarks
An understanding of how support and resistance levels work and knowing the ways to identify them will drastically improve the profitability of your trades. It will eliminate any guesswork or ‘intuition-based’ emotional decisions.
This tool is not perfect, as we have seen Dogecoin soaring over 60 cents in a period of months at the beginning of 2021. If we had used resistance levels from the previous months, our trading decisions would not be effective.
Also, nobody predicted the big crypto dip we are in at the moment, and support levels were at $45,000. At the time of writing this article, the price of Bitcoin is well below $40,000. Therefore, despite being an incredibly useful tool, support and resistance levels should be used in combination with external factors and other analysis tools for the best results.


