In trading, time frames refer to the time interval created by a trader to track the price changes of an asset. Trade candlesticks correspond to the time interval, meaning that a larger candlestick takes more time to create than a smaller one.
Time frames are useful for traders because of the difference they can make in helping increase profit margins and minimize risk. Some traders prefer working with short time frames, while others are more confident when using medium or long time frames. However, it is also not uncommon for traders to use a blend of long and short timeframes.
There are no rules for traders to employ particular time frames for particular trades, but it all comes down to strategy. The main time frames are discussed below.
Short time frames
Short time frames have characteristically fast changes to prices. This also means that your trade positions come to a close within a short time, translating to profit-taking or loss-making within small time spans. Typically, short time frames trades refer to trades that close in under an hour. This type of timing is preferred by scalpers and short-term traders.
Medium time frames
This type of time frame typically spans between an hour and 4 hours (H1 to H4). Its price changes also take slightly longer. It is mostly favored by day traders because it allows them to generate returns within the day, while also giving them time to analyze the market, reassess their previous moves and plan adequately on how to execute their next trade.
With this type of trade, you can take time off to let your current trade come to a close while strategizing on your next move. Unlike short time frames, it does not require you to continuously keep your eyes on the screen.
Large time frames
These are time frames that typically span from more than five hours to daily and monthly. This means that price changes on their charts are comparatively slow. They are ideal for long-term traders because they allow you to view the market and price changes from a wider perspective, with many fundamentals and technical considerations in play.
However, note that you need a relatively large sum of funds to employ long time frames because the fluctuations in price over a long period can wipe out your account when the market goes against you. Therefore, a well-cushioned account ensures that you remain in business as you wait for the market to bounce back in your favor.
Time frames in trading strategies
1. Time frames in position trading
Position trading requires you to customize your time frame to fit the strategy you intend to execute. This means that you can tweak your time frame to track the price changes, depending on how fundamentals may impact the asset. You can shift from daily and weekly to monthly and yearly.
In many instances, using a day-trading approach to position trading may not be ideal because position trading means holding on to a position for a long time. This may create confusion for some traders. Therefore, position traders are better off using longer time frames in their strategy. This means working with weekly or monthly time frames.
Example
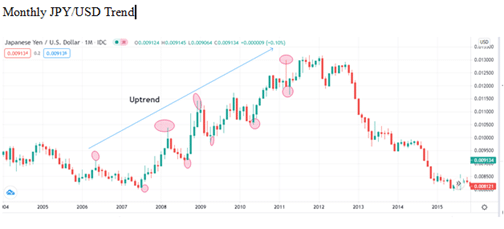
From the chart below, a trader can study the monthly trends by looking at the critical support and resistance levels.

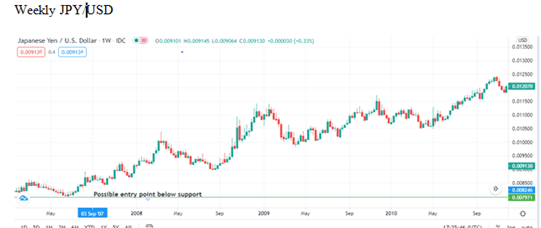
Thereafter, they can execute their strategy by taking positions on the weekly price chart. Here, you can enter positions based on the trend or use technical indicators as well.

2. Time frames in swing trading
You can look at swing trading as the intersection between long-term and short-term trading. Having established the reliability and efficiency of the chart with the longer time frame as discussed above, you can transition to a shorter time frame and reduce your holding time.
This has the effect of blending the strengths of long-term and short-term trading while significantly reducing their downsides. This kind of approach to trade, therefore, has some element of “scalping” in it.
The strategy also gives traders some time to take their eyes from watching charts because it only requires one to periodically peep to see if there have been any significant changes to the price action. After familiarizing yourself with the established trend, you are then better equipped to know the best place to locate your stop. In between the intervening periods, you can seize the windows of opportunity to profit as they present themselves.
Example
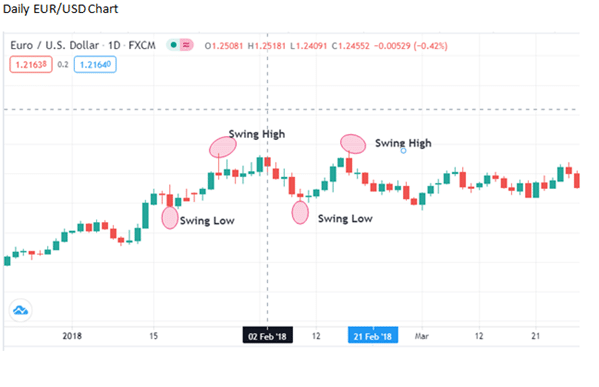
In this approach, the two charts used were the daily charts and the 4-hour chart. In this case, the trends on the daily charts help us to identify the appropriate entry levels for the trade. From the daily chart, we can see how the price has swung up and down, and we can spot the lows and highs of the two swings (marked as Swing High and Swing Low).
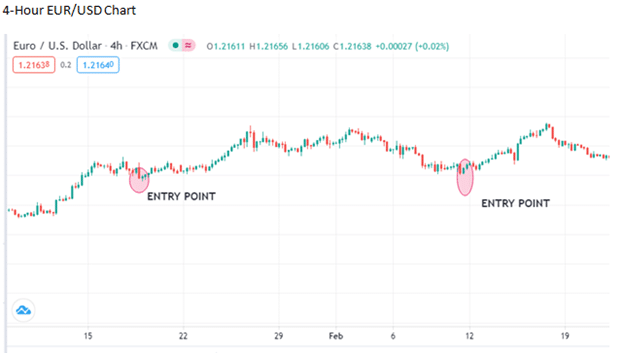
Traders typically attempt to propel swing lows back to the levels of the previous upswing. We can use this to our advantage because we are confident of a forthcoming upward trend. As a swing trader, you will then reduce the time frame to H4 and use it to identify entry points. As seen in the chart below, your target should be the resistance level established on the four-hour chart. Wait for the price to go above this resistance level, then go long.


Bottom line
Time frames can be a useful tool for a smart trader to improve their profits. However, for them to work in your favor, you should identify the best combinations and the best strategies to use with them.


