Standard deviation exemplifies the technical framework for successful online trading. Understanding the optimal timing to enter the market and predicting future trend reversals are two of the most difficult problems that traders encounter.
Standard deviation is one of the most useful indicators in this context. This indicator can have a big impact on investment strategies since it helps traders comprehend the market’s trends, which can lead to investors entering trades too early or too late. Many traders are comfortable with indicators that favor higher volatility, and this indicator gives the best results on volatility.
Definition of Standard Deviation indicator
Standard deviation is a mathematical concept that determines how evenly distributed numbers are. In other words, it determines how much variance or dispersion there is in a group of numbers. Thus, the standard deviation indicator is a statistical measure of market volatility that determines how far prices differ from the average. The standard deviation will produce a low number if prices trade in a small trading range, indicating low volatility. In contrast, if prices fluctuate drastically, standard deviation returns a high result, indicating extreme volatility.
Calculating standard deviation
Below is a formula for calculating the SD.

N- The number of price values in a set given in the indicator’s parameters.
Xi- The i-th member of the set. It is the closing price of each candlestick all across the selected time period.
Xavg- The arithmetic mean of all price values in the set. It’s a Simple Moving Average in technical analysis terms.
Calculation steps
- Calculate the arithmetic mean value for the time period you’ve chosen. For example, if the period is set to 10, the price arithmetic mean for the previous 10 candlesticks is determined. By default, closing prices are used.
- Subtract the result from the value of each price.
- Square the values and sum them up.
- The final value is multiplied by the number of entries in the series, which equals the period in typical settings.
- Calculate the result’s square root.
Example
| Date | Price close | Xi-Xavg | (Xi – Xavg) 2 |
| 25/07/2020 | 222.87 | -2.206 | 4.86 |
| 26/07/2020 | 223.89 | -1.186 | 1.41 |
| 27/07/2020 | 226.34 | 1.264 | 1.60 |
| 28/07/2020 | 219.26 | -5.816 | 33.83 |
| 29/07/2020 | 220.65 | -4.426 | 19.59 |
| 30/07/2020 | 225.96 | 0.884 | 0.78 |
| 31/07/2020 | 228.87 | 3.794 | 14.39 |
| 1/08/2020 | 227.95 | 2.874 | 8.26 |
| 02/08/2020 | 226.54 | 1.464 | 2.14 |
| 03/08/2020 | 228.43 | 2.143 | 4.59 |
| Σ=225076 | Σ=91.45 |
Xavg=225076/10=225.076
Standard deviation =√1/10 × 91.45 =3.024
How to set it on chart
The indicator appears as a single line that swings up and down when applied to a chart. When a currency pair is moving higher, the standard deviation is usually low. When there is more volatility, though, the indicator tends to rise.
The indicator’s default setting is 20. The number of recent periods is used to determine the deviation by the indicator. The indicator will calculate the standard deviation over the last 20 days on a daily chart. Increasing the indicator’s period to above 20 will reduce its sensitivity. It will get more sensitive if you lower it to less than 20.
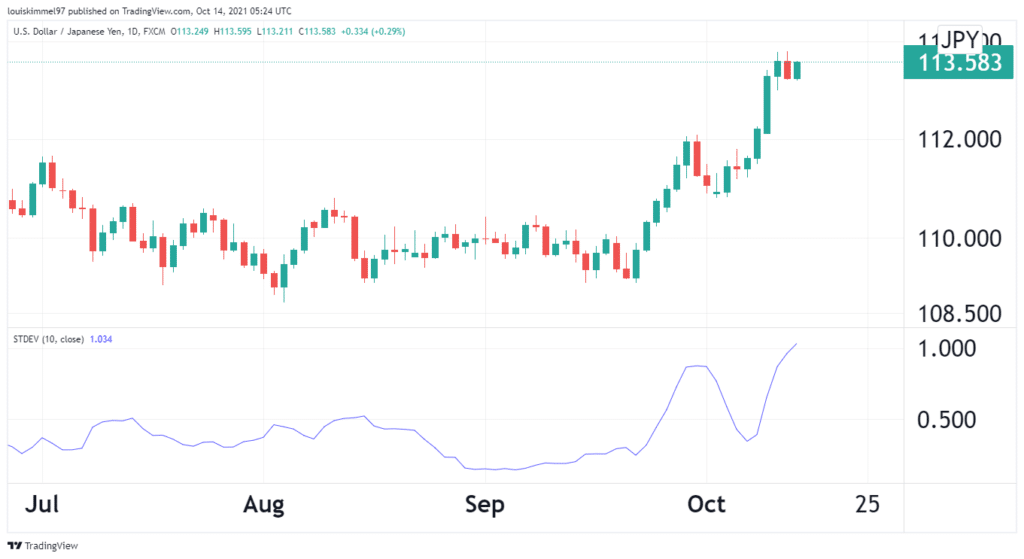
Below is the USDJPY chart with plotted 10-day Standard Deviation.

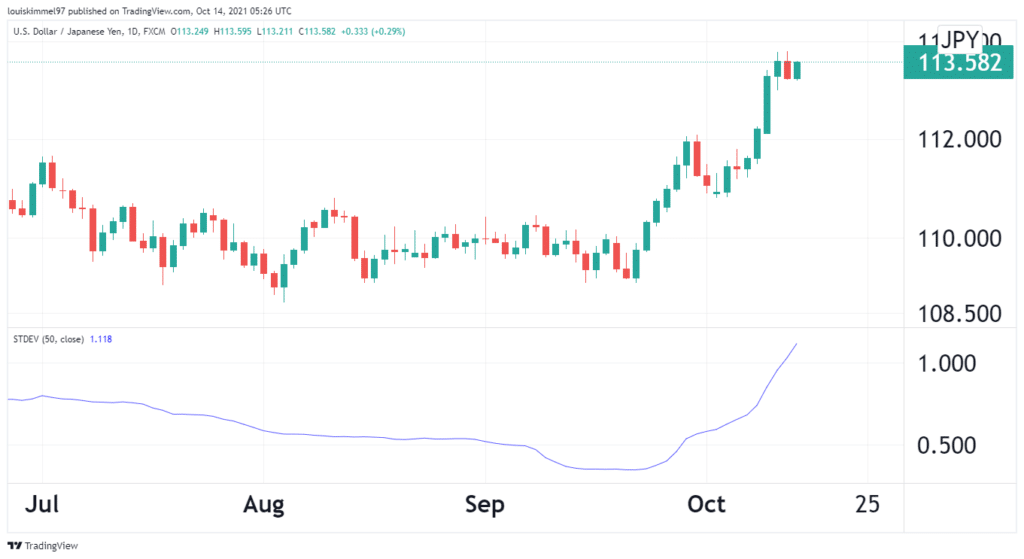
And here is the 50-period Standard deviation applied to the same chart.

I used 50-day and 10-day standard deviation indicators in USDJPY. The indicator creates a considerably smoother line with a value of 50. It, on the other hand, gives exceptionally high or low values less frequently.
The standard deviation line reaches extraordinarily high or low values more frequently with a setting of 10. As a result, there are more trading possibilities, but there are also more erroneous indications about whether volatility will rise or fall in the future.
Standard Deviation indicator application in trading
Trading breakouts
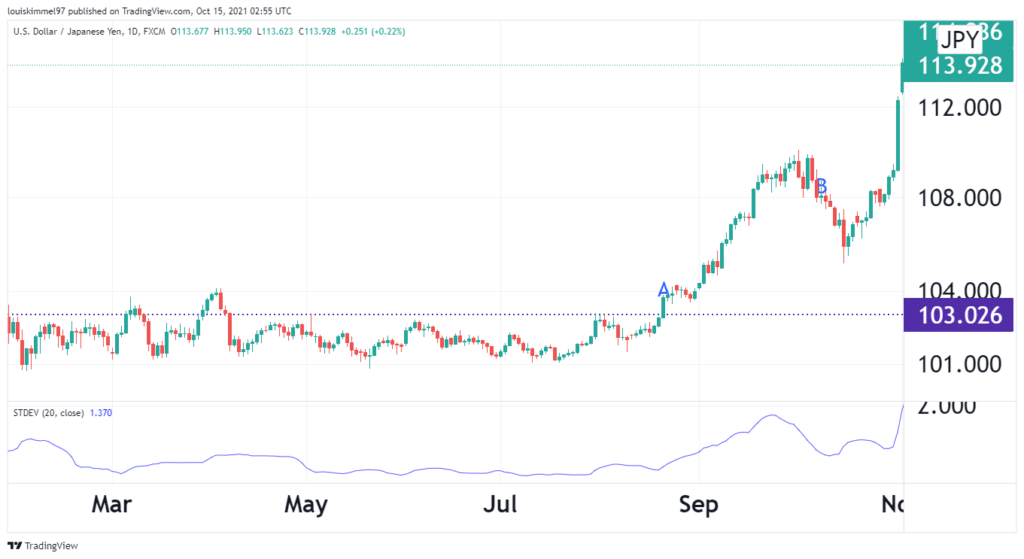
This is a conservative approach. In a range, the price does not deviate too much from its mean value. When standard deviation begins to grow and moves outside of the flat range, it generates a signal to open a trade. Open a trade on the next candlestick, following the trend once the candlestick breaks out of the flat range. Once the indicator begins to reverse, close the position.

In the USDJPY chart above, the horizontal line is the resistance line. Enter the trade at point A, which is 103.026. The Standard deviation indicator was also trending upwards after the flat breakout. At point B, there was a reversal. The Standard Deviation started trending downwards. Close the trade at this point which is 108.000.
Determination of when to enter a trade
This is an aggressive strategy. It involves entering your trades early based on the Standard Deviation waves. Most of the time, traders wait for a signal to enter, thus delaying the time when they should enter the trade, which can reduce profitability. The Standard Deviation indicator has the advantage of reducing these delays. Signals are generated more frequently too.
Conditions for entering a trade
- StdDev’s lows should be used to draw a support level. For the H1 time range, set aside 2-3 weeks.
- Once the indicator has crossed the support level and has continued to expand, open a trade.
- The market’s direction is determined as follows: open a long position if the preceding wave’s half was moving downwards. Open a short position if the preceding wave’s half was heading upwards.
- Follow the preceding method if a flat range preceded the previous wave’s half. Divide the wave in half if it has two or more tops. Ignore the signal if the wave can’t be clearly detected, is asymmetrical, or if the beginning and end can’t be clearly distinguished.
Pros
- It’s easy to read. The higher the value of the indicator, the greater the price volatility.
Cons
- The indicator tends to lag. While the indicator suggests volatility is minimal, the price may have already exited the range.
- There is no indication of a trend. The market deviates from its “normal” price further as the line grows, although the deviation can be upward or downward.
Conclusion
The Standard Deviation is a statistical measure of volatility. It is very easy to read and calculate. In trading, it can be used to determine when to enter a trade, and it is also used to trade flat breakouts. The indicator is more effective when used together with tools like the Simple Moving Average.


