
A breakout refers to the movement of a price trend line outside the previously established range of critical support and resistance levels. Breakouts usually herald new trends, which may be either bullish or bearish, depending on whether the price appreciates or depreciates.

Types of breakouts in trading
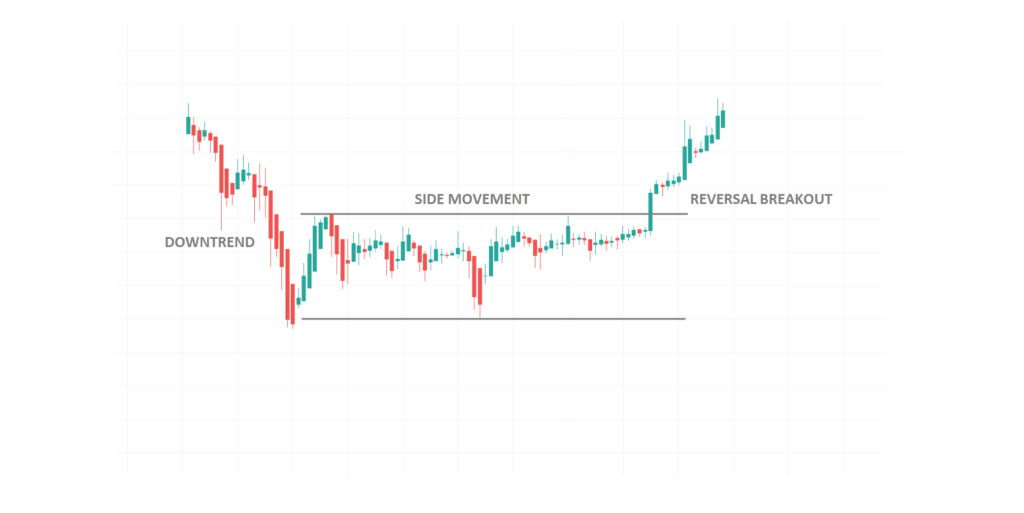
Reversal breakouts
This type of breakout typically comes after a period of consolidation. It usually comes as a result of a strong push by either bulls or bears, which results in a return to the opposite of a previously established trend.
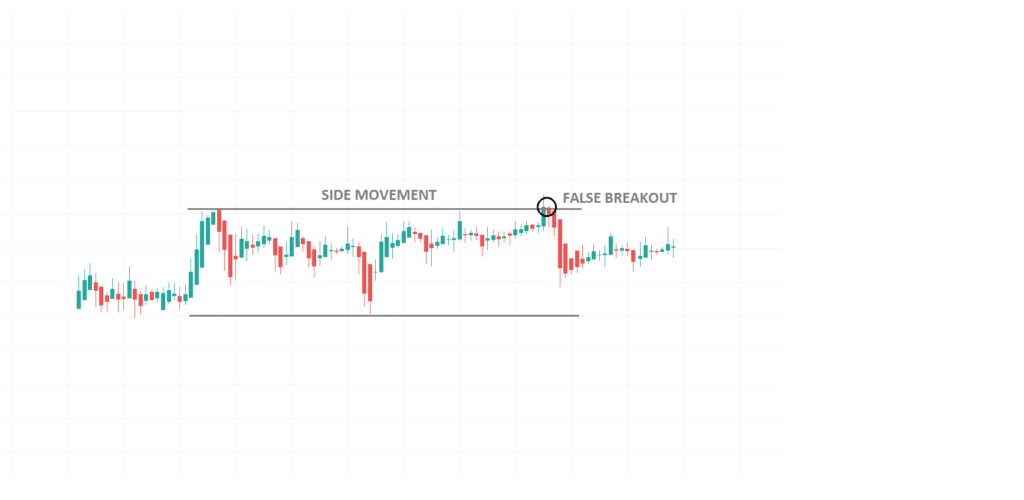
False breakouts
These are breakouts that fail to live up to traders’ expectations, in that the trends they establish often end within a short time span. While they may not establish long-lasting trends, false breakouts are usually the precursor to new trends. In some instances, false breakouts may transition into the resumption of a previously established trend.
Therefore, traders need to be keen on how they respond to these trends. Failing to read a false breakout for what it is may result in costly trade calls.
Therefore, false breakouts should be seen as traps or baits. It is important to use appropriate indicators and fundamentals to confirm the authenticity of any movements outside the established trends.
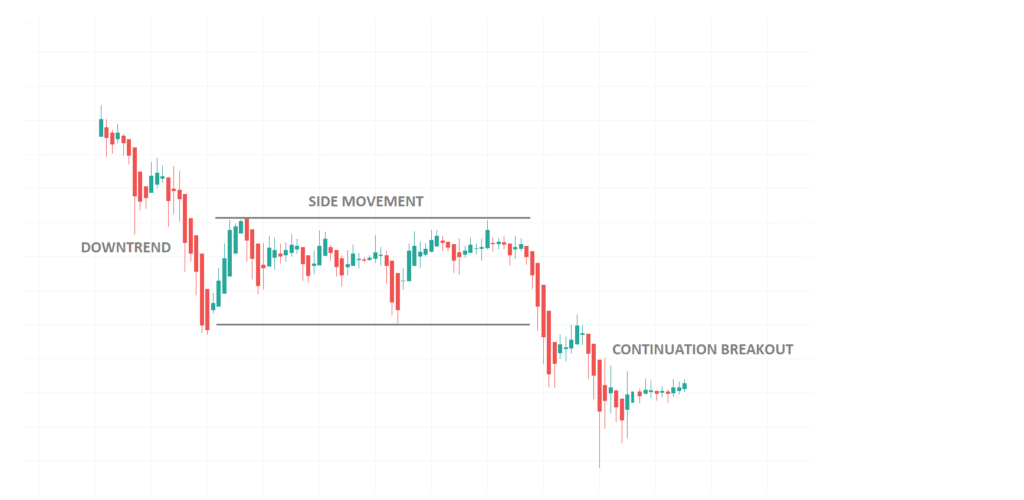
Continuation breakouts
As inferred from the name, this type of breakout is a continuation of a previous trend. It usually comes in after a short “pause” from a previous trend. You can think of the “pause” as the transition period when traders weigh their options as to whether or not to continue trading the trend. The continuation comes in after the “interruption” caused by the “pause”, once the traders have made up their mind and decided to stick to the previous move continuation.
How can you identify breakouts?
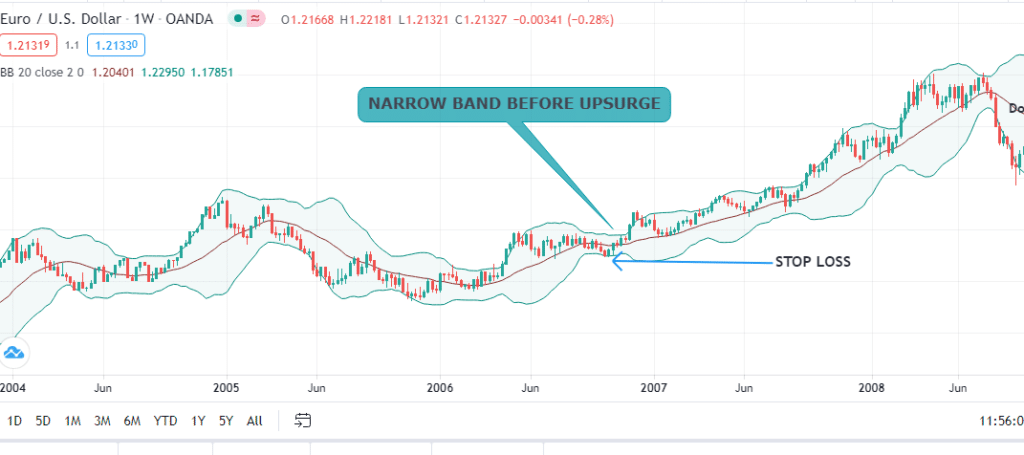
Bollinger Bands
The band and the price move at a synchronized pace, but the bands will typically contract or expand, depending on the margins of price movement. The common default setting for the Bollinger Bands is 20 period, but you can tweak it to fit your preference.
Large price movements result in the bands deflecting away from each other, while small price movements will correspond to the bands moving closer to one another. Breakouts can be monitored using these bands by looking at whether the price has moved above the band.
For example, in the chart below, the price action was in a lull, but a movement of the candlesticks outside the bands heralded an uptrend breakout. At that point, the band’s width became noticeably narrower than its previous size. Bollinger Bands are therefore reliable technical indicators when tracking breakouts.
Relative Strength Index
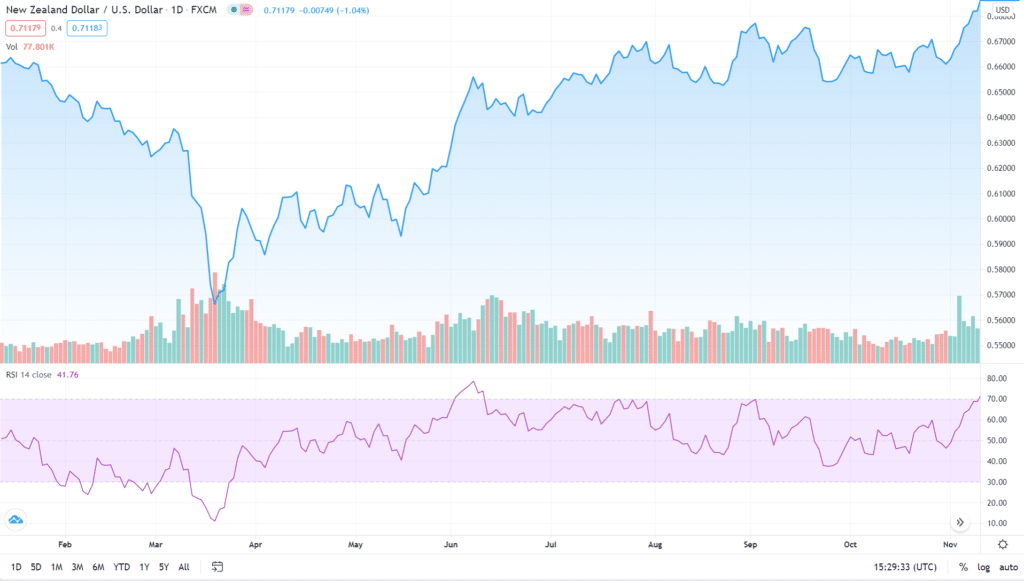
The Relative Strength Index (RSI) is a reliable indicator that measures the momentum of the current trading trend based on the relationship between the price of the asset and the volume bought. The RSI uses a scale ranging between zero and a hundred. The key levels in the RSI are 30 and 70.
A stock or a forex pair is said to be oversold when its RSI falls below 30. This is a strong signal that there is a high chance of a spike in the demand for the asset, which should result in a price rally.
When the RSI indicator rises beyond 70, the underlying asset is said to be overbought. This sets the stage for a possible decline in demand, with a price fall in tow. Therefore, movement by RSI in the two territories is indicative of a looming breakout.
For example, the chart below shows how the price action changed in the period following the RSI’s movement into oversold territory.
Moving Average Convergence Divergence (MACD)
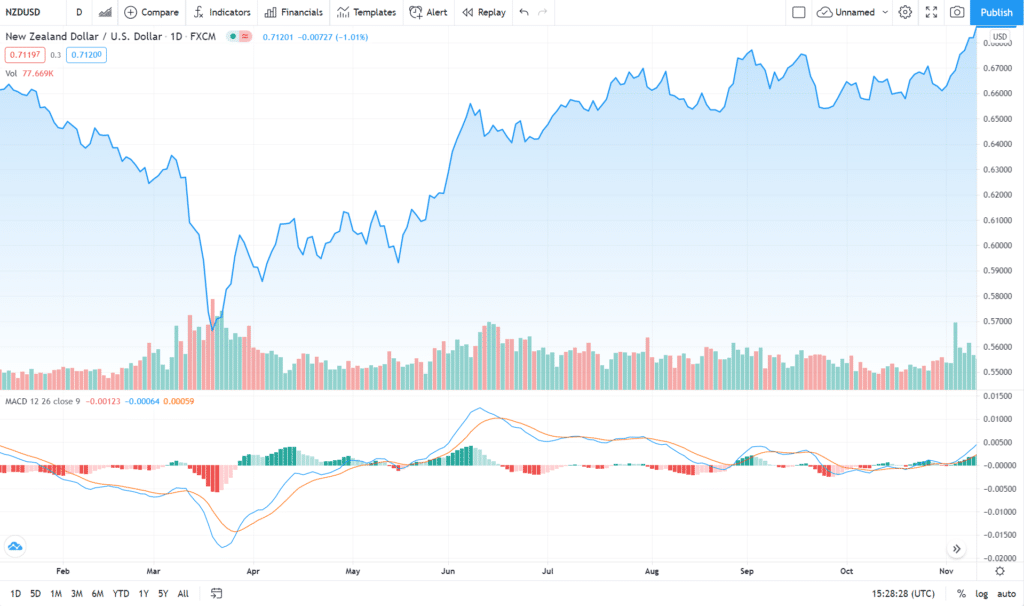
Moving Average Convergence/Divergence (MACD) is used by traders to weigh the strength of the forces causing a breakout. Traders study the MACD in relation to its movement below or above a trading session’s signal line.
A breakout is interpreted as a buy signal when the MACD line crosses from below to above the signal line. The intersection between these lines sends a strong buy signal. The converse is interpreted as a sell signal.
In the chart below, the price moves upwards once the fast line transects the slower line from downwards, as shown in the highlighted area.
Key tips for trading breakouts successfully
1. Track trading volume
This is one of the most reliable ways of assessing whether or not a trend will hold or if the breakout is likely to be false. Ideally, a change in the price trajectory should have a corresponding significant change in the volume traded.
For example, a sudden spike in prices is a reliable indicator of an upward breakout if it is accompanied by a proportional increase in volume.
Conversely, if the price surges suddenly, but the change in trading volume is minimal, then the breakout may be a false signal and may not hold.
It is however worth looking out for other relevant indicators, including a change in fundamentals, because volume surges alone may not be adequate to support price changes under certain circumstances.
2. Use volatility to your advantage
From time to time, markets tend to have periodic volatility. If you are a day trader, the best approach to take is to work out the average hourly price range. Using the figure obtained, you should then be able to know entry points for breakouts during high volatility and profitable trading ranges when volatility is low.
Remember to keep your eyes and ears alert for changes in market fundamentals, which may cause an upset, regardless of whether the volatility is high or low.
3. Trade the trend in breakouts
Trading while following the trend can provide you with excellent opportunities to spot breakouts. Once you identify the key support and resistance levels, you can then keep an eye on the candlesticks for the formation of a wedge, a triangle or any other formation that will signify a breakout.
4. Enter when key support or resistance level is retested
This type of trade is all about establishing ranges within which to trade by drawing key levels of support and resistance. The price can oscillate between these key levels without requiring action from your end, but once the action moves upwards to retest the drawn resistance level or downwards to retest the support level, you should make your move.
Repeated touching of these levels is a sign of an impending breakout. As you may have already noticed, this strategy requires a considerable level of patience, because prices often take a long time before testing these points.
5. Have an exit plan and stick to it
Breakouts have a tendency of causing market hysteria, which often results in volatility. This therefore calls for a smart trader to have a predetermined plan to close their positions once they achieve their goal. Buying into the hype that follows a breakout may result in costly losses.
Bottom line
Trading breakouts is a proven way of getting the most out of price action. However, one needs to ensure that they have correctly interpreted the signals and are in touch with the prevailing changes to market fundamentals.

