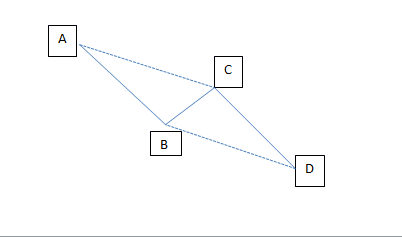
The ABCD pattern is a harmonic pattern that follows a consistent alignment of shape, time, and price. A bullish ABCD pattern comes after a downtrend, and it signals that an upward reversal is imminent. In contrast, a bearish ABCD pattern comes at the end of an uptrend and indicates a potential bearish turn at that point.
Using the same techniques, you may trade the ABCD patterns, whether in bullish markets or in bearish ones. The only difference is that you need to consider the pattern’s direction and the market movement it predicts. The pattern is built on the measurements of the Fibonacci retracement tool.
Types of ABCD pattern
Classic ABCD
The classic ABCD calls for point C to lie 61.8% or 78.6% of AB. To locate point C, we use the Fibonacci retracement tool to measure up to the 61.8% level on AB. Point D should be at the Fibonacci expansion of BC between point 127.2% and 161.8%.
You will notice that if you retrace point C to 61.8%, you trigger the extension of BC to 161.8%. But if you retrace C to 78.6%, BC stretches to 127%.

·
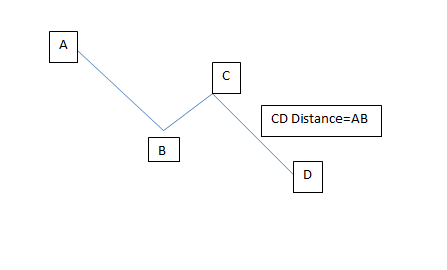
AB=CD pattern
CD and AB are both exactly the same length in this case. In addition, the market travels the same duration from A to B as it does from C to D. As a result, the viewing angles of AB and CD are identical. Popular among traders, this form of ABCD pattern can be found pretty frequently.

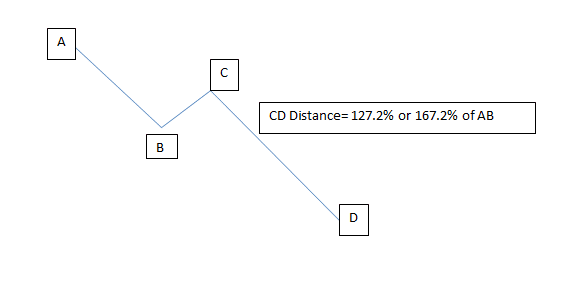
ABCD extension
This type occurs when CD is 127.2%-161.8% of AB’s length. CD can be as much as two times larger than AB. CD may end up being far longer than AB, as evidenced by certain trends. Gaps following point C or large candlesticks at point C are the two most common types.

Trading the ABCD pattern: some pointers
- The ABCD pattern is straightforward, but mastering it can be a challenge. When compared to other patterns, there are many factors to take into account.
- You should only trade setups that are worthy of attention. It’s possible to do so if you are extremely selective. You don’t need to spend time studying or analyzing a setup if it’s not perfect.
- Having an understanding of when to trade is one thing, but knowing when to avoid trading is equally vital. Before you trade, make sure you’ve checked all the boxes on your trading checklist.
Entry point
ABCD patterns are commonly used by traders after a breakout above the morning highs.
Then again, bear in mind that your risk is set at the bottom of the B leg. Because of this, if the breakout is too distant from the B leg’s bottom, it may be preferable to avoid the trade altogether.
The asset that grinds upward and closes strongly on high volume can lead you to buy the C leg before the breakout, but this is an extremely rare occurrence.
You should avoid markets that are extremely choppy or are trading at a higher volume relative to the A leg during this time. It is possible that many short sellers may be pushing back against the buyers. It’s possible that even if the price breaks out, it will be smothered immediately afterward if that is the case.
Exit point
There are a number of variables that need to be considered to decide on where to exit.
Consider utilizing a risk/reward ratio of 3:1 if the B leg’s bottom falls within a narrow range of the A leg’s morning high. Nonetheless, a ratio of 2:1 could be an option in several other situations. Everything hinges on the stock’s fair price goal.
Overnight trading is a popular method for certain traders who hope to profit from potential price swings. Keep in mind, however, that this can lead to unanticipated consequences. It’s possible that a sale may be made overnight or that there will just be a severe sell-off.
However, if the chart looks terrific and the market is booming, you might want to give it a shot. Before the end of the day, make sure you cash out.
Take profit
Trade the ABCD pattern with these target points in mind:
- Take profit 1 is a 38.2% retracement of AD’s high.
- Take profit 2 is 61.8% retracement along with AD.
- Take profit 3 is located at point A.
Technical analysis tools such as support and resistance levels shown on charts are also essential for use in trading. Remember to keep an eye out for support and resistance levels in older timeframes.
If the price accelerated too quickly to your first profit target, it is likely to continue to the second target. In contrast, if the price takes a long time to reach the first target, it may be the only one you will obtain. It is not uncommon for the market to reverse after the AB=CD pattern goes beyond point A.
High breakout volume
A breakout is all that you should look for after you’ve discovered a clear buy signal on your chart. As long as the price and volume breakouts are occurring at the same time, this is a strong indicator.
Low volume during consolidation
The ABCD is most effective when combined with other technical indicators, as is true for most types of technical analysis. Therefore, it is worth checking the changes in the trading volume to help you validate a reversal. This is especially important if you’ve established that the asset characteristically consolidates faster after a trend.
The volume refers to the number or quantity of assets traded over a specific time. It gives a good assessment of how strong the market is and how likely the current price action will hold. You should be wary of basing your decision on the ABCD pattern if you see that volume is unusually low during the consolidation phase.
In summary
The ABCD pattern is an excellent place to start for beginner traders because it is simple and straightforward. Time and price both play a role in creating the pattern. Traders can use this pattern to identify potential reversal zones and revert to the direction of the main trend when all three patterns come together in a single move.


