A symmetrical triangle in a trading chart is formed when two sloping price lines intersect from a lower high (LH) and higher low (HL) position in the trend. This pattern gives way to a short-term bullish continuation in an upward breakout since the prior price-line is an uptrend.
In a downward breakout, the pattern envisions a short-term bearish reversal that moves against the prior price trend.
The performance improves when the pattern forms close to the yearly-low position due to the busted growth formation. In upward breakouts, throwbacks hurt the predictability of the pattern. Pullbacks in downward breakouts will harm the performance of the symmetrical triangle.
Identification guidelines
1. Breakout analysis
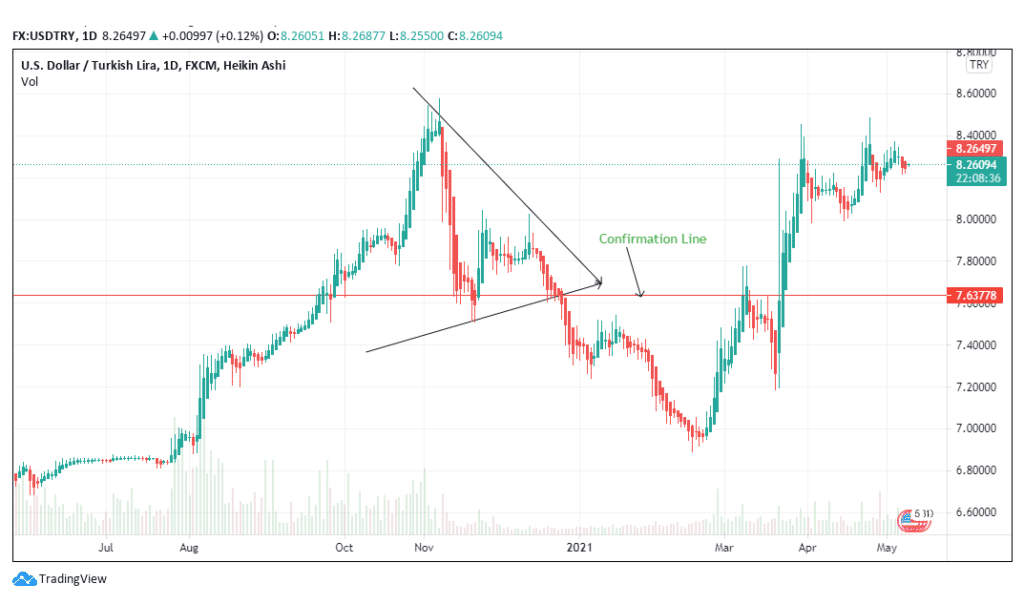
Figure 1: Symmetrical Triangle in the USD/TRY trading pair
The upper part/slope of the pattern in figure 1 begins on November 6, 2020, and extends to January 11, 2021 (according to the daily trading chart). Close to the intersection of the two sloping lines is the confirmation line that establishes the downward breakout. The line has been confirmed at 7.6378.
However, the pattern was not formed close to the yearly low in May 2020. This means that the pattern’s performance would not be perfect in terms of prediction. As a paper rule, we expect the downward breakout to continue after the pattern is identified, but the trend is overtaken by a bullish continuation on February 22, 2021.
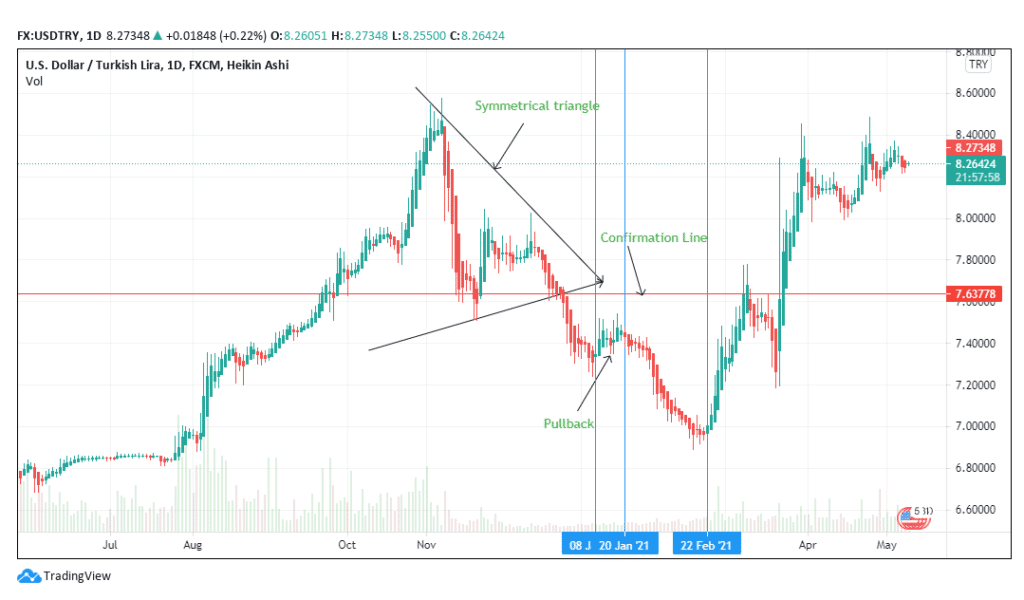
Figure 2: Pullback in the downward breakout of the USDTRY pair
Additionally, the presence of the pullback from January 8 to January 20, 2021, confirms that the downward trend of the forex pair would be short-lived. Long-term traders should desist from buying a pullback that occurs after a symmetrical triangle forms in a trading chart.
This short-up trend presents a buy signal for short-term buyers, especially day traders. However, trades should be executed with caution since the pullback may hit a reversing point sooner than expected. The swing traders should avoid the pullback altogether.
The symmetrical triangle in figure 3 (on the EURJPY) forex pair does not have a throwback in the upward breakout scenario. Therefore, this illustration can be used to illustrate price movement after the pattern.
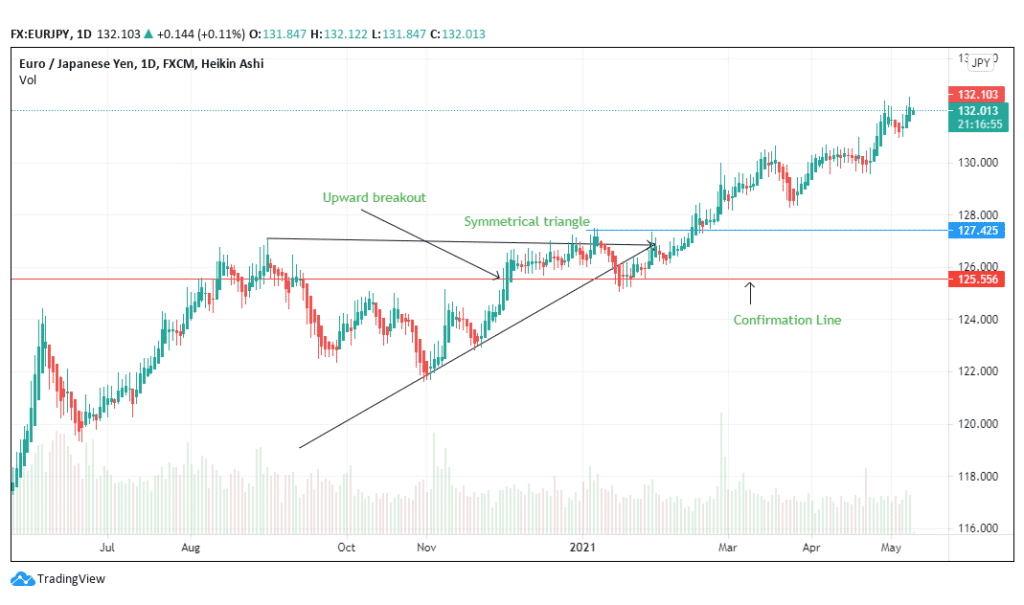
Figure 3: Upward breakout confirmation in the EURJPY trading pair
After the upward breakout in figure 3, the price trend has gone ahead to form a short-term bullish continuation. After a short retracement between October and November 2020, prices continued to hit an uptrend.
This pattern was confirmed at 125.556, where prices continued and hit a new high of 127.425 before the breakout continued. After confirmation, prices rose 5.21% to 132.103 on May 11, 2021.
For swing traders, this increase is significant as it shows buying pressure is paying off, making the pair a bargain to other traders and investors. During the pattern’s formation, the fall in price was caused by minimal selling activity that pushed the pair’s price towards a prior support line. The pair fell to a bargaining level.
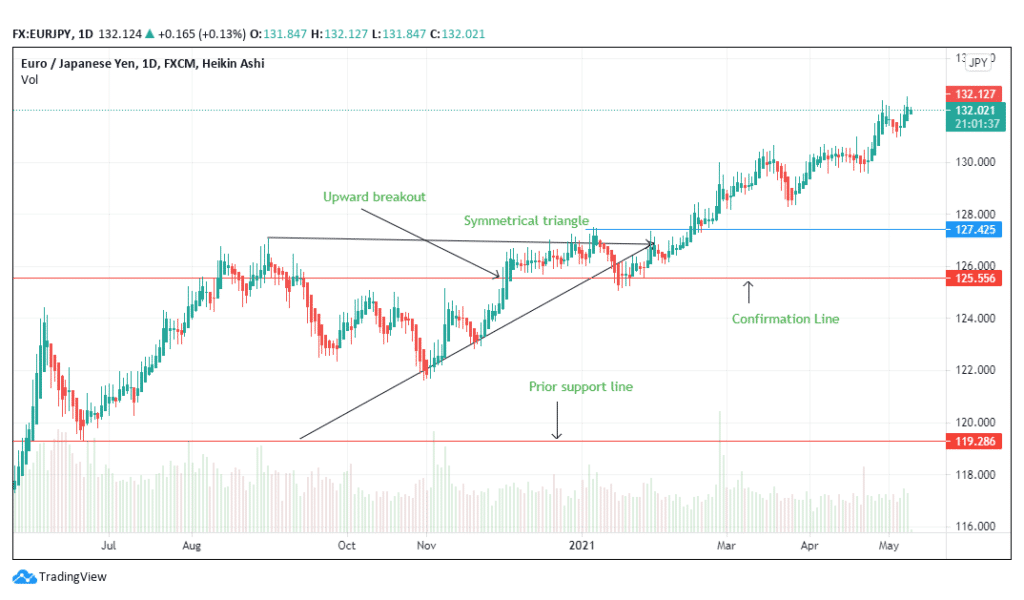
Figure 4: Prior support line of the EURJPY pair
In figure 4, the prior support line is at 119.286. The lower rising slope of the symmetrical triangle also touches this point further, establishing the pattern’s strength.
The proximity of the pair’s price to the prior support line began to decline during the pattern’s formation, further helping the trader prepare for an impending trend change. Prices surged after the pattern due to the consistent buying pressure based on increasing demand.
2. Formation shape
The two trend lines (upper and lower) slope towards an intersection, forming a triangular shape. It is not required that the two trend lines be of similar length. The upper faces downwards, while the other face higher.
This rule applies in both upward and downward breakouts. The apex also helps to establish the breakout direction. In figures 1 and 2, the apex supported the occurrence of a short-term bullish reversal, while figures 3 and 4 favor an upward breakout.
It is not a requirement that traders wait to open or close a trade at the apex. The confirmation line should guide the trading style.
3. Touches
Both trendlines in the symmetrical triangle should touch the price points at least twice. In figure 5, the pattern touches three minor highs (in the upper sloping pattern) and two lower high points.
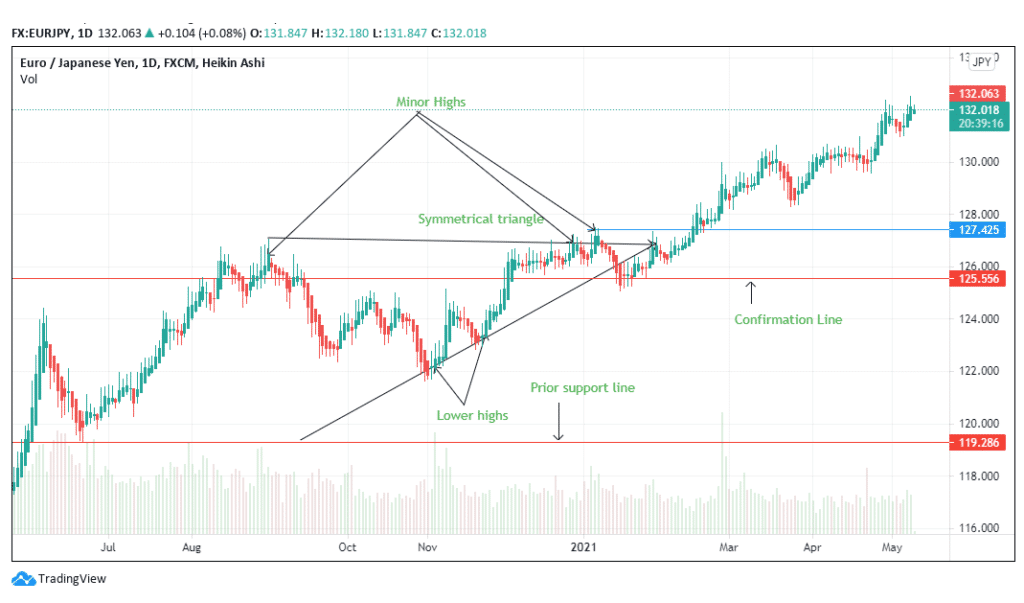
Figure 5: Minor and Lower high points in the EURJPY pair
These minor and lower high points indicate reversals to be anticipated by the trader. If the lower highs outperform the minor highs, the trader should prepare for a bullish continuation in the case of an upward breakout.
The trading chart will proceed with the bearish reversal if the minor highs surpass the lower highs. Figure 5 shows that the lower highs have outperformed the minor highs since the retracements are longer in the bullish direction.
There is a stronger price movement as it crosses the triangular pattern severally before reaching the apex. Less white space is seen within the symmetrical triangle as the price moves along. An increase in the white area shows minimal price activity giving room for the trader’s speculation rather than observation.
4. Volume
Figures 3 to 5 depict the volume movement with the red and blue bars below the price line (for the EURJPY trading pair). Volume was high in May 2020 as sellers took control of the market, and it receded with slight irregularity until the symmetrical pattern was formed.
After the breakout, it continued to decline, albeit with some irregularity. While buyers gained the upper hand, sellers had mixed activity, especially towards the breakout direction.
Identification guidelines
Identifying this intriguing pattern in forex means understanding the different types, which we’ll cover below.
Different types of triangles
Triangles are popular methods of trading breakouts and appear across all markets and time frames. We have three kinds: the symmetrical triangle pattern, the ascending triangle pattern, and the descending triangle pattern.
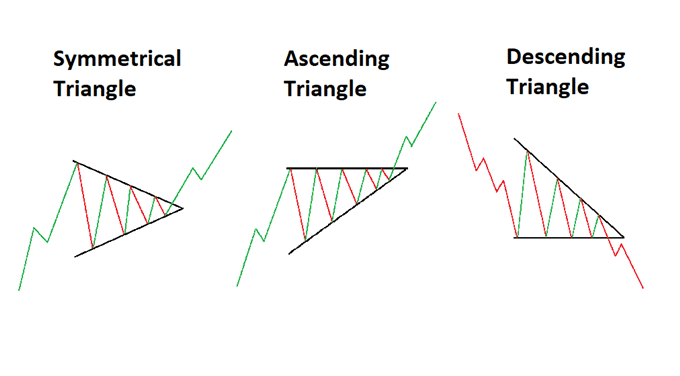
Figure 6: Simple drawn-out demonstrations of the three types of triangles
Regardless of the type, all these follow similar components. Firstly, any triangle strategy generally involves identifying moments of trend resumption. Yet, there are some occasions where reversals happen from this pattern.
Triangles involve drawing two lines converging to a specific point during a period of consolidation.
What’s crucial about any triangle strategy is not trying to draw the perfect pattern. In many cases, the price might break out well before the two lines in the triangle meet completely. The essential point is understanding what the price is communicating to you.
While the triangles have similar appearances, traders don’t interpret them in the same manner. This means you must understand each individually.
Symmetrical
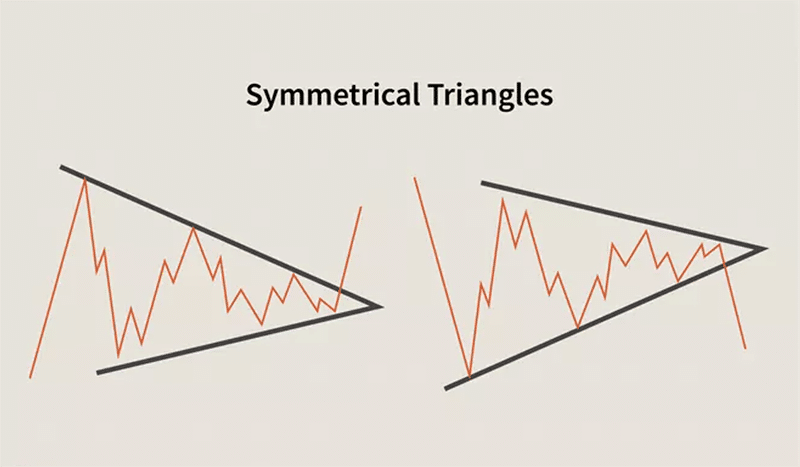
Figure 7: Drawn-out demonstrations of symmetrical triangles
The symmetrical triangle resembles an acute triangle. Here, we have an ascending and descending trendline coming together (see image above).
Interestingly, a symmetrical triangle breakout doesn’t always suggest the continuation of a particular trend direction. This means we can interpret the pattern as a continuation or reversal.
Ascending
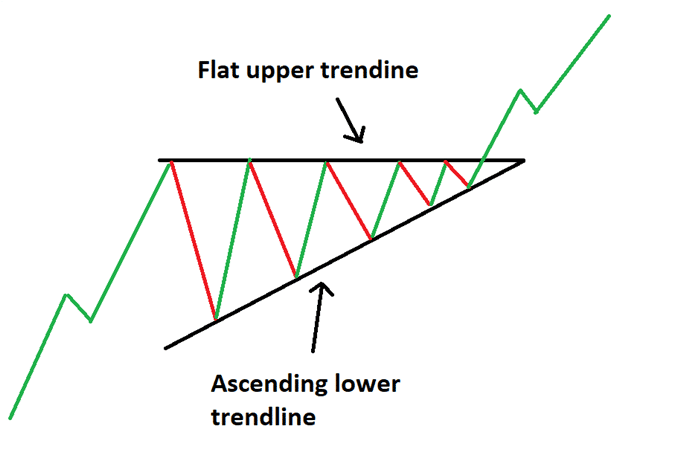
Figure 8: Drawn-out demonstration of an ascending triangle
The ascending triangle occurs in a bullish market. It consists of a flat upper trendline (a resistance area) and a rising, slanted trendline. As shown in the image above, the price will test the resistance multiple times.
However, it will still progressively make higher lows on the lower trendline indicating more buyers than sellers. As the price becomes tighter in the triangle, there’s an expectation of an eventual breakout to the upside.
Yet, it’s worth mentioning that the market can sometimes move in the other direction.
Descending
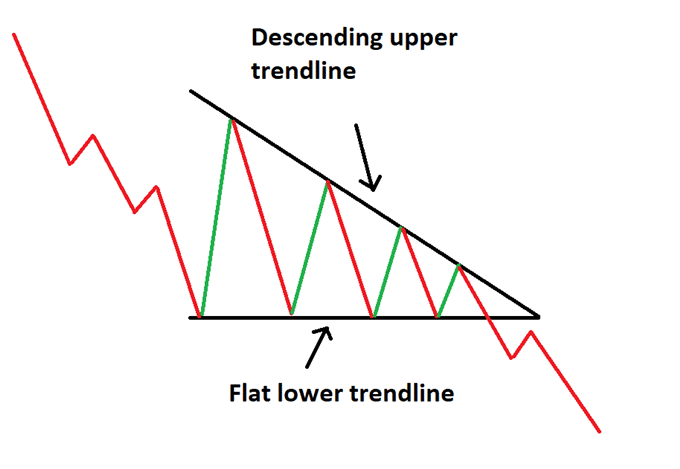
Figure 9: Drawn-out demonstration of a descending triangle
Of course, the descending triangle is the opposite. We have price approaching and testing a support area numerous times, which is the flat lower trend line.
The other slanted trend line will be falling and tracing the market, making lower highs. Over time, as the consolidation continues, traders anticipate a breakout to the downside.
Again, it’s worth mentioning that the market can sometimes move in the other direction instead.
Trading tactics
One of the key things to note about triangles is steering away from false breakouts. Although traders cannot avoid these in all cases, there are a few techniques to consider.
The first typical method, which is slightly aggressive, is entering with pending orders placed on either side of the triangle’s converging point. Regardless of the triangle, traders would place both buy and sell orders to take advantage of either potential scenario.
The other more conservative technique is waiting for a clear close of a candle once the price has broken out of the triangle before entering with market execution.
We’ll go over a few pointers for the tactics to trading triangles and a real example where we incorporate much of what we’ve discussed.
- Plot upper and lower trend lines as price moves to know the type of triangle. Moreover, identify the predominant trend to anticipate the directional likelihood of the breakout.
- Traders typically place their stop loss above a recent high or low, depending on the type of triangle.
- For profit targets, the rule of thumb is taking the triangle’s vertical height as your reference point. Of course, this rule is not set in stone as the price could travel further. In this case, traders should have a method to lock in profits.
Trading example
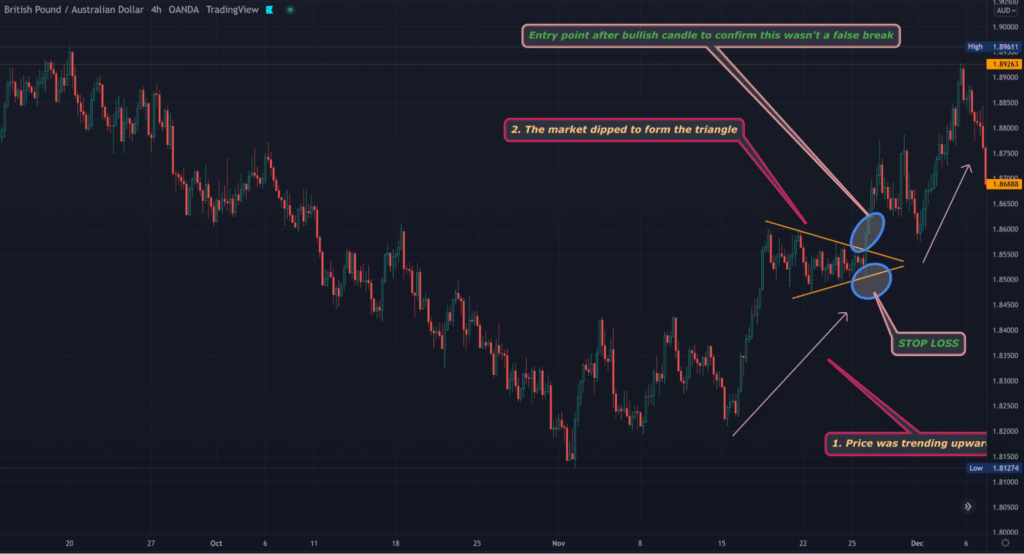
Figure 10: GBPAUD 4HR TradingView chart of the symmetrical triangle
On the 4HR chart above, we can see the market was in an uptrend before the pullback, which eventually formed the triangle, ‘squeezing’ price into a tight consolidation.
As mentioned earlier, the price can break out well before the two trend lines meet. Eventually, the market moved out of the pattern and resumed the uptrend. We’ve also outlined the entry point where one would have entered after a clear close of the bullish candle to avoid a false breakout.
Conclusion
The symmetrical triangle pattern can be used to depict an upward or a downward breakout. In both directions, the apex is close to the confirmation line. Traders should wait until the breakout direction is confirmed to enter or exit a trade.


