Technical trading involves the use of charts, indicators, and price action patterns to predict market movement. Candlesticks are widely utilized in this form of trading as they increase the overall winning probability of executions. Developed by the Japanese in the early 1700s, it quickly got its worldwide fame in the financial industry, becoming the primary weapon of price action traders. Our article will discuss a few different candlesticks and introduce you to a highly qualified pattern that can help develop consistency.
Types of candlesticks
There are many types of candlesticks that you may see on a chart. Their shape and configuration are dependent on the time frame. Let us shed some light on a few notable patterns that a trader can frequently see.
- Evening or morning star. It has a small body usually centered at one end. You can spot it at the end of a trend and use it as a sign of reversal.
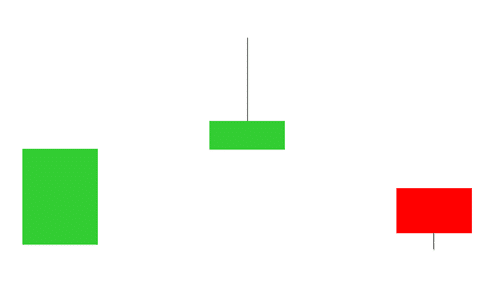
An evening star pattern.
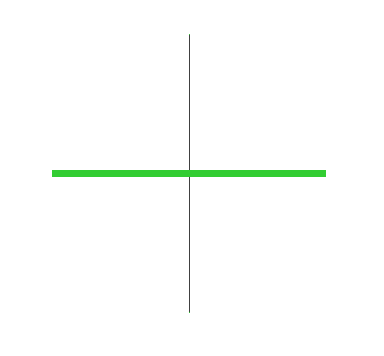
- Doji. The pattern shows indecision of the market to go in either direction. It also has a petite body indicating the opening and closing areas within a short-range.
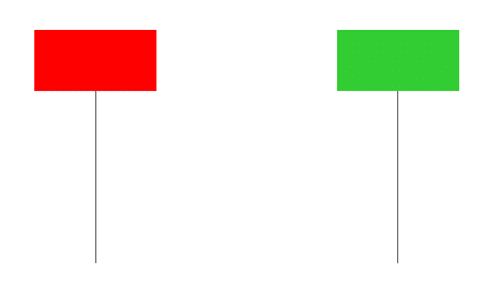
- Hammer. A bullish reversal candlestick that a trader can find at the bottom of a trend. It resembles a hammer and therefore gets its name.
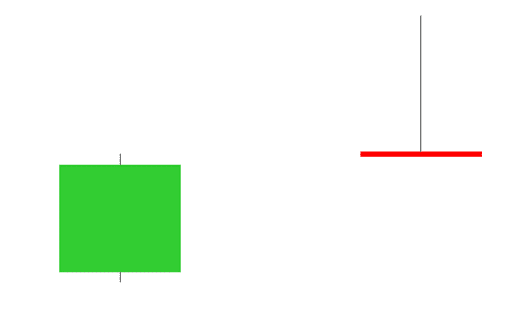
- Shooting star. It rhymes with the evening star pattern; however, this one strongly indicates a potential reversal from an up to a downtrend. The candlestick has no upper body and has a nonexistent body.
- Bullish and bearish engulfing. One of the vital indicators of reversal and the primary choice of traders is these candlesticks. The pattern forms when the upcoming candle completely engulfs the preceding candle.
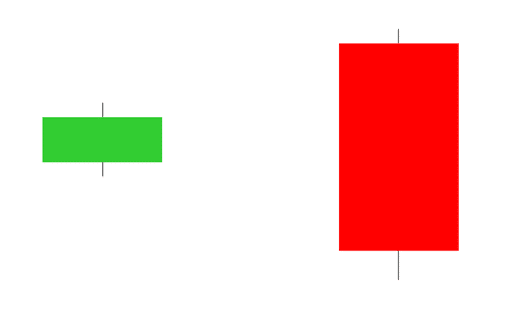
Bullish and bearish engulfing candlesticks
The two candlesticks offer the best winning probability amongst all the patterns. The bullish engulfing is used for going long while the bearish for short trades.
Price action
The price action strategy has been known since the inception of technical trading. It involves using Fibonacci, key levels, trend lines, supply and demand zones, and support and resistance. Candlestick patterns such as bullish and bearish engulfing are a prime choice of price action traders. Let’s highlight an example where the candle forms on the chart and supports our execution.
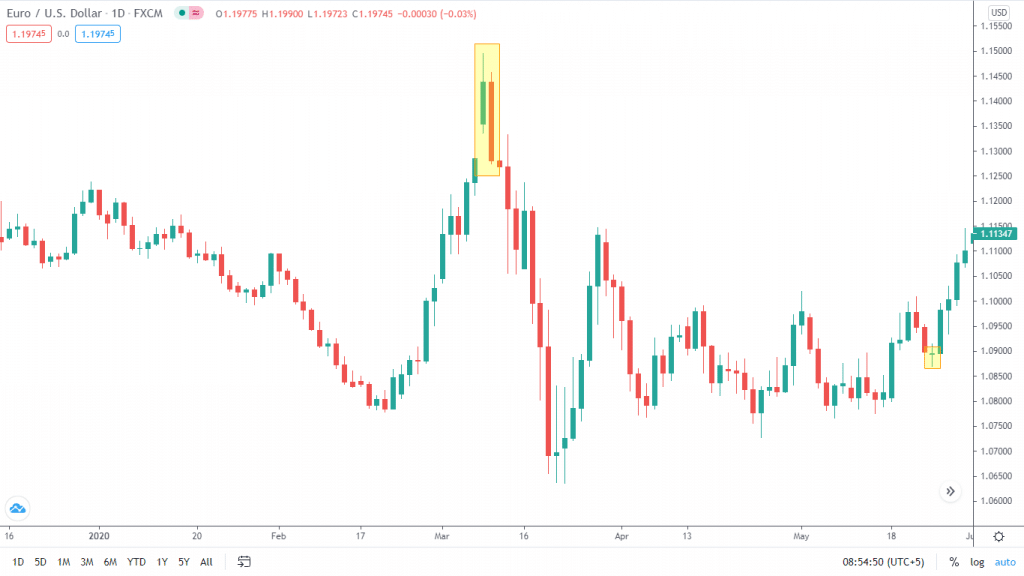
Image 1. A simple bearish engulfing pattern on the daily chart at EUR/USD. We are not considering price action trading here. Still, the move towards the bottom is strong with a risk-reward of nearly 1:3.
As a price action trader, you will be looking out for these candlesticks on potential trend lines, key levels, and Fibs. You can place a stop loss above or below the candle or use ATRs.
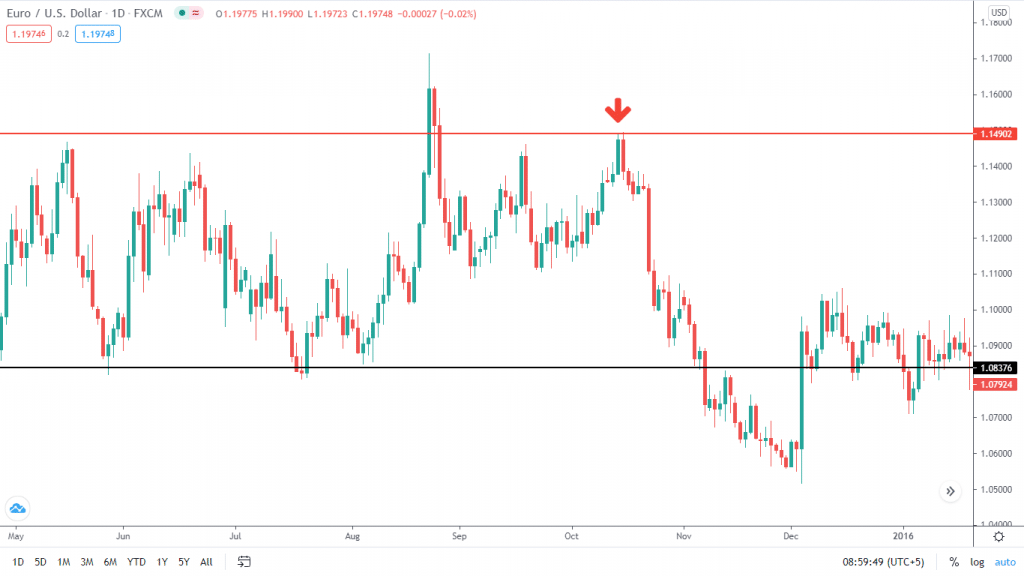
Image 2. The red line highlights the daily key level, whereas the black indicates a weekly. As soon as the price retraces to the daily, we look out for bearish engulfing patterns. After realizing one, we enter a short with our stop exit above the candle and profit towards the next key level.
The market doesn’t need to give out the same pattern, and there can be some fluctuations. Your ability to adapt to it will determine how good of a trader you are. You can also combine one or two candles to form a single engulfing candlestick. The following image states the condition when the pattern is not up to the mark.
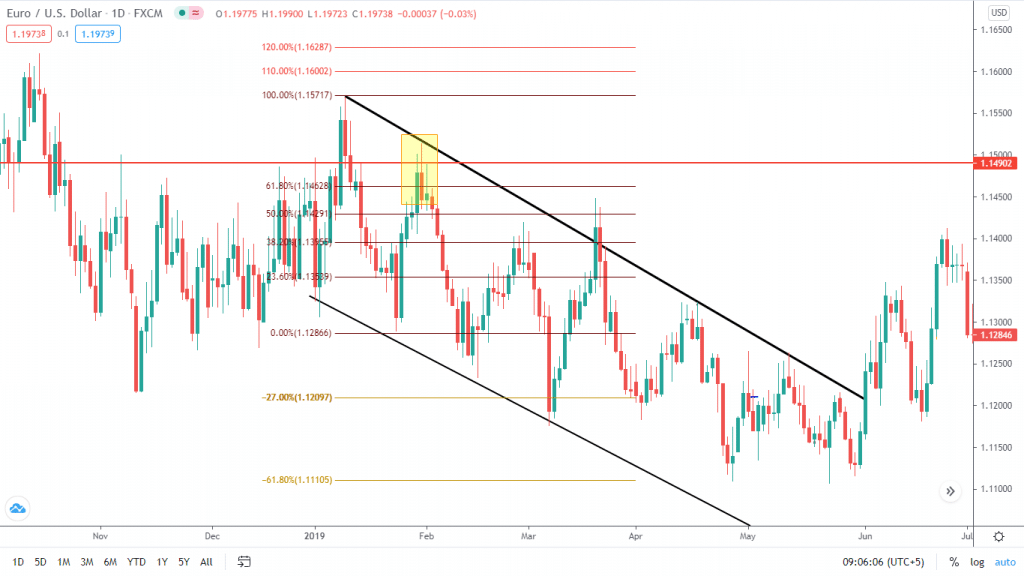
Image 3. The chart may seem cluttered with price action indicators. Our execution’s bearish setup is confirmed by the trend line, daily key level, and the 31.8% retracement on the Fibs. The bearish candlestick is not up to the mark, but we can still jump in to combine the three candles that yellow color highlights.
Technical indicators
Indicators such as moving averages, Bollinger Bands, MACD, RSI, etc., are also a major component of technical trading. They are coded algorithms that give buy or sell signals based on user interpretation. They employ the same methods like price action trading as several confirmations are necessary to enter a trade. However, the scope is limited to indicators only and the use of candlesticks.
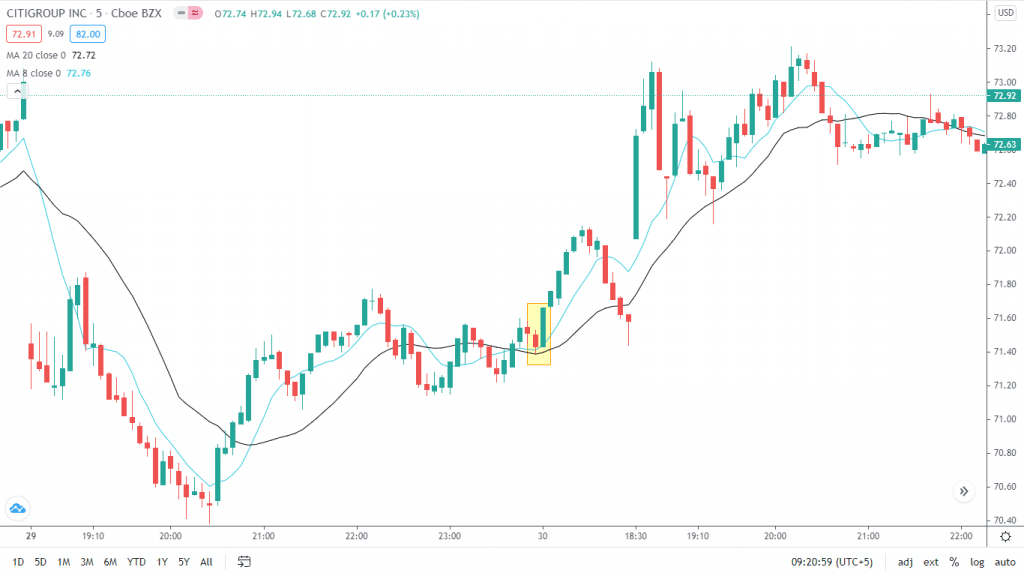
Image 4. A moving average crossover strategy uses the bullish engulfing pattern to enter long on C at the M5 chart.
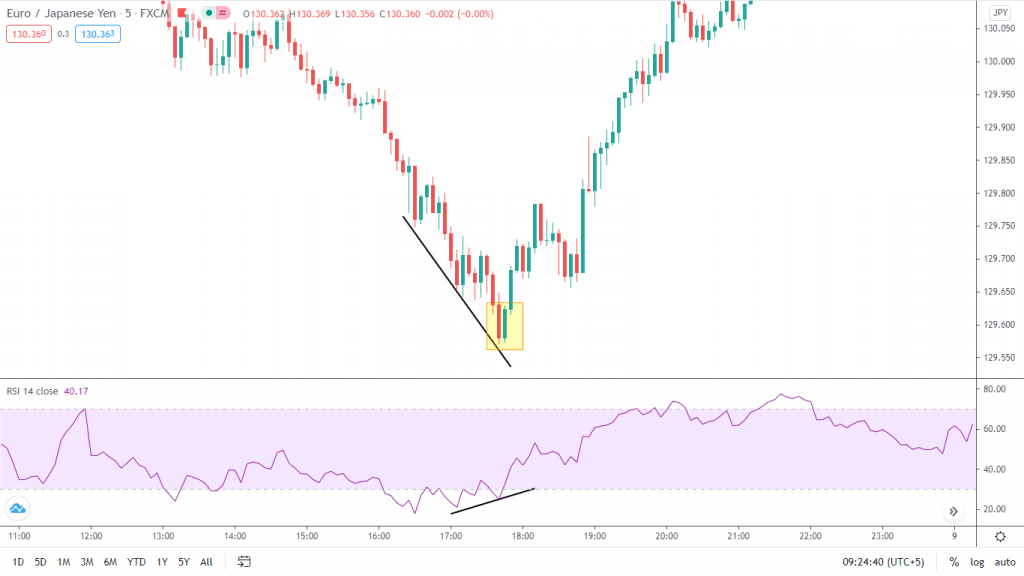
Image 5. A trader spots divergence in trading while using the RSI. As the price is making lower lows, the indicator is plotting higher highs. He waits for the bullish engulfing pattern to enter the trade, which forms soon after with an excellent risk-reward scenario.
The possibility of using multiple indicators and candlesticks is also present. Make sure that the two complement each other appropriately. A trend and a reversal tool will create confusion if utilized together.
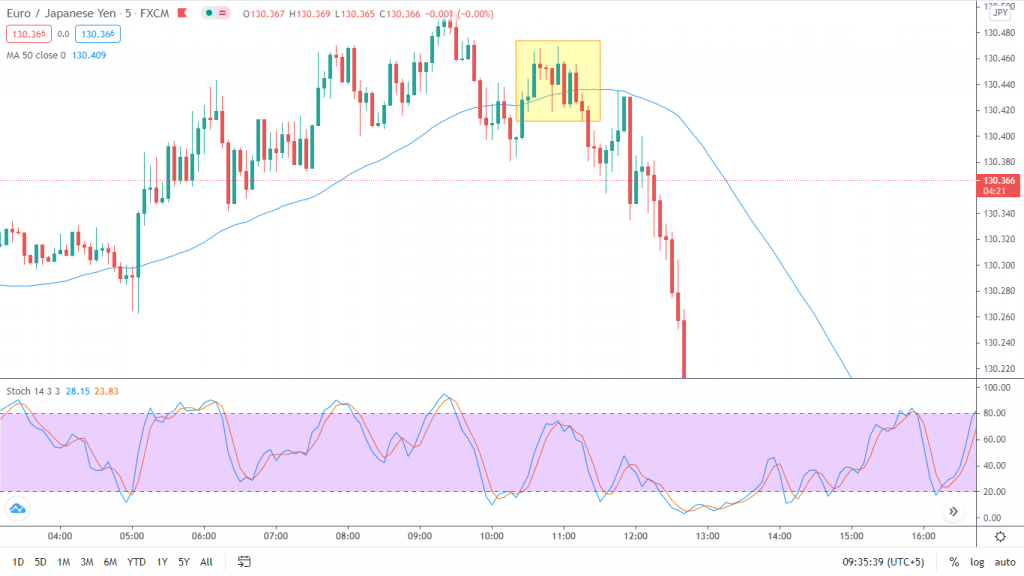
Image 6. Stochastic indicator realizes overbought conditions, whereas the 50-period moving average indicates a potential point of resistance. The bearish engulfing pattern comes into play here for confirming our sell trade.
A trader can also use a combination of price action, indicators, and engulfing candlesticks. Professionals with extensive trading knowledge follow this type of strategy.
End of the line
While candlestick patterns can help with your trading decisions, one should not ignore the importance of maintaining their risk and psychology. To implement these strategies mentioned above, try them out on a virtual portfolio to see if they work for you. By no means should a trader switch his trading style in case there are no hiccups in his previous methods.


