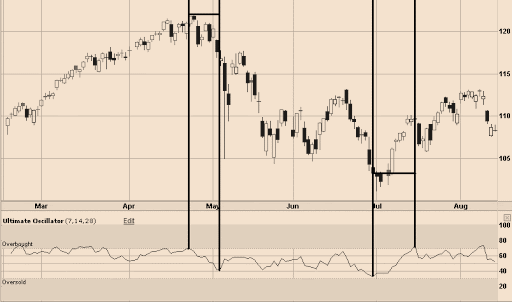
What Are Oscillating Indicators?
They are indicators that move back and forth as currency pairs rise and fall. The name is quite self-explanatory in that way. Oscillating indicators are here to help you figure out the strength of the current trend of a currency pair as well as when the trend is exposed to a possible loss in momentum and turning around.
The basics in understanding oscillating indicators include two aspects and that is high and the low. When the oscillating indicator moves too high, the currency pair is said to be overbought. This implies that the currency pair is at a risk of momentum loss and turning around to move sideways or lower. Similarly, when an oscillating indicator moves too low, the currency pair is said to be oversold. This implies that the currency pair is at a risk of momentum loss and turning around to move sideways or higher.
There are several different oscillating indicators.
Our focus here is Commodity Channel Index, Moving Average Convergence Divergence, and Slow Stochastic.

Using Commodity Channel Index (CCI) in Forex Trading
Donald Lambert is the architect of the Commodity Channel Index or CCI which is an oscillating indicator. What this indicator shows is how buoyant and bearish traders are towards the currency pair and how sensational those sentiments are. The CCI also lets you see the volatility of a currency pair very much like Bollinger bands. The CCI is generally plotted beneath the price movement on a chart.
Trading Signals:
Commodity channel index or CCI yields trading signals as it cruises back and forth, above and below, between 100 and -100.
- Entry Signal
When the CCI surges above 100 and then turns around and crosses back under 100, that is when you can sell the currency pair while being insightful that buyers have depleted their momentum and the currency pair is prone to deteriorate in the imminent future.
Similarly, when the CCI drops below -100 and then turns around and crosses back over -100, you can buy the currency pair with the insight that sellers have depleted their momentum and the currency pair is prone to ascent in the imminent future.
- Exit Signal
When the CCI turns around and initiates movement higher after you have sold a currency pair you can place your stop-loss simply above the nearest level of resistance.
Similarly, when the CCI turns around and begins moving lower after you have purchased a currency pair you can place your stop-loss right below the nearest level of support. If the currency pair turns around and moves below support, then your stop-loss will pull you out of the trade.
Using Moving Average Convergence Divergence (MACD) in Forex Trading

Gerald Appel is the architect of the Moving Average Convergence Divergence or MACD which is an oscillating indicator that shows you when trading momentum alters from being buoyant to bearish and from being bearish to buoyant. It is also capable of presenting you when traders are becoming overextended which typically results in a trend reversal for the currency pair. The MACD is plotted typically beneath the price movement on the chart.
Trading Signals:
The Moving Average Convergence Divergence or MACD yields trading signals as it crosses side to side, above and below the trigger line.
- Entry Signal
When the MACD surges above the trigger line you can purchase the currency pair while being insightful of the knowledge that the momentum has deviated from being bearish to being buoyant.
When the MACD drops below the trigger line you can sell the currency pair insightful of the knowledge that the momentum has deviated from being buoyant to being bearish.
- Exit Signal
When the MACD crosses back below the trigger line when you have purchased the currency pair, you can sell the currency pair back, aware that the momentum has altered from being buoyant to bearish.
When the MACD crosses back above the trigger line when you have a sold the currency pair you can purchase the currency pair back, aware that the momentum has altered back from being bearish to buoyant.
Using Slow Stochastic in Forex Trading
George Lane is the architect of this oscillating indicator. The Slow Stochastic is an oscillating indicator that can show you when investor sentiment alters from being buoyant to bearish and from being bearish to buoyant. The indicator is also capable of showing you when traders are becoming overextended which typically results in a trend reversal for the currency pair. The Slow Stochastic is generally plotted beneath the price movement on a chart.
Trading Signals:
The Slow Stochastic yields trading signals as it crosses back and forth through its upper and lower reversal zones. The upper reversal zone is the area of the indicator that is over 80 while the lower reversal zone is the area of the indicator that is under 20. When %K is below 20 it shows the currency pair may be oversold and may be reversing trend shortly whereas when %K is over 80 it shows the currency pair may be overbought and may be reversing trend shortly.
- Entry Signal
When %K goes from above 80 to below 80 you can sell the currency pair with the insight that investor sentiment towards the currency pair has switched from being buoyant to being bearish.
When %K goes from under 20 to over 20 you can buy the currency pair being aware that investor sentiment towards the currency pair has switched from being bearish to being buoyant.
- Exit Signal
When %K reverses the direction after having crossed either over 20 or under 80 and crosses over %D you can exit your trade insightful of the knowledge that investor sentiment is altering direction again.
Conclusion
As a trader, oscillating indicators are quite useful when applied to forex trading as it helps you determine the strength of the currency pair’s current trend. Additionally, it also helps in determining which trend has the chance of losing momentum and will turn around.


