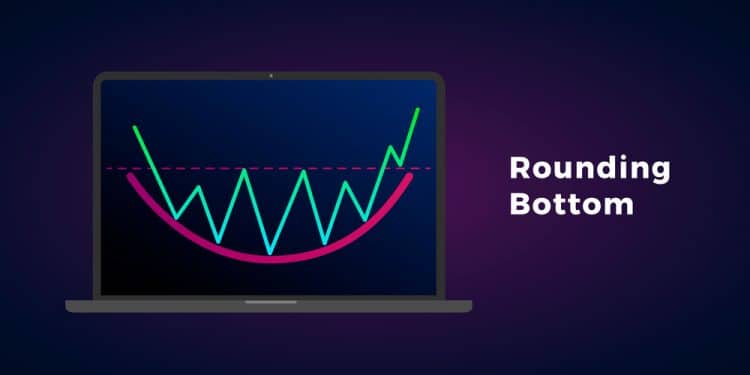
The rounding bottom pattern is a saucer-like pattern that curves in a concave. It indicates that the price turns and consolidates, making a short-term bullish trend. The consolidation means that the price will move sideways, and stock revolves around meeting the support or resistance as observed in the range. Rather than acting as a continuation, the bottom (rounded) pattern is a reversal of the dominant (long-term) trend. Traders will have an easier prediction with the U-shaped turn having a rising volume. The pattern is mainly found at the end of the yearly downward trend. It shows a reversal of the long-term movement in price.
Identification
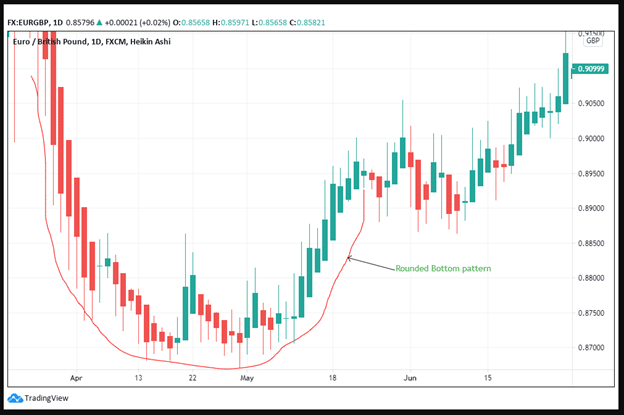
Figure 1: EUR/GBP forex analysis
Figure 1 shows that the rounding bottom dips in April and recovers in mid-May 2020. The rise is significant as it proceeds through June to the rest of the year.
The bowl shape of the rounding bottom can form for as long as 2.5 years. In figure 1, the bottom bowl-shaped has formed for a month. In our case, the trader shifts focus from a downtrend and prepares to take profits in a bullish trendline. Before the rounded bottom formed, prices had declined from 0.90999 to 0.87000. Prices peaked with intermittent volume rises evident when using the weekly or daily charts.
Unlike the head and shoulders pattern, the two sides of the rounded bottom do not have to be equal in length or price movement. The dip (at the bottom) represents the head, while the two opposite sides look like the shoulders.
The volume trend of the curve shows the price movement from the downtrend until it reverses. This movement is predominantly a saucer-shape (at least 54% of the rounded bottom cases). It can also be U-shaped (at least 46% of the time). Additionally, just like the cup and handle pattern, it has a rounded bottom with a handle. It forms when the prices reach an old-high area.
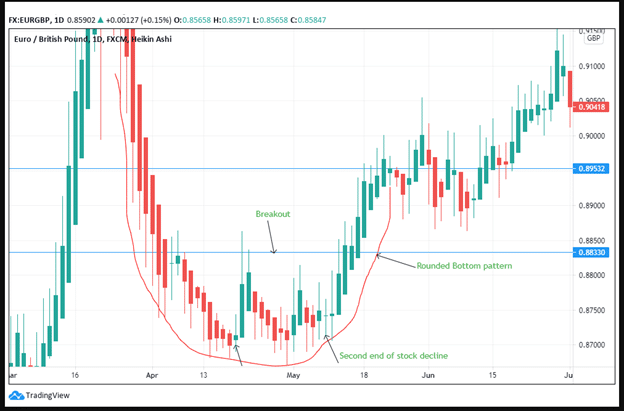
Figure 2: Breakout area
There are two significant upward retracements before the price movement hits a strong bullish reversal. The breakout begins at the prior price trendline after the bullish movement was confirmed. The two corrective movements rise from a low of 0.87000 to 0.88000.
This trend is significant because the lowest position in the rounded bottom was 0.87000. A consistent push above this line means that the EUR/GBP currency pair has found support in the area and is headed towards the breakout position. The breakout is at 0.88330. Prices have climbed past 0.87500 and closed above it. This sets the stage for the breakout as the price does not falter. It proceeds and peaks over the prior trendline.
The rounding bottom differs from the double bottom pattern, although both formations initiate a short-term bullish reversal. Further, the rounding bottom will take place after an extended or a longer bearish period. However, the double bottom may commence after a shorter period. Both patterns indicate a bullish reversal. Investors watching this pattern may go long or buy the stock to get profits from the bullish rally. In most cases, the rounded bottom does have a double bottom. This pattern confirms the bullish trend.
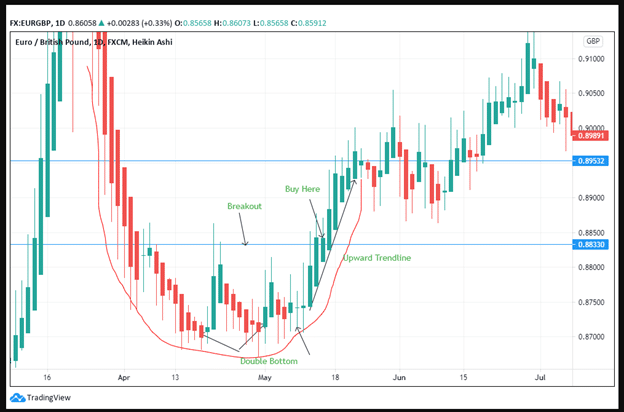
Figure 3: Double Bottom within the Rounded bottom Pattern
Trading Strategies
1. Target price computation
The trader expects that the price will reverse from the bearish trend unto a bullish move. In figure 3, the line marked breakout first indicates the currency’s neckline. Get the difference between the neckline position and the highest position on the right saucer (at the upward trendline). In our case, the difference will be obtained by subtracting 0.89532 with 0.88330. It is equal to 0.01202. Add this difference to the highest position (0.89532) or subtract it to get the lowest position after the price hits the target. So, in this case, the price is either higher or lower depending on the trend movement.
2. Watch for the breakout
It is always vital to wait for the breakout before initiating the buy option. A false breakout may signal a sell rather than a buy position. The trader will be at a loss if he underestimates the breakout and buys after the price moves higher in the trendline. In figure 3, if the trader waits until the price moves past the breakout and buys the stock at 0,89532, he will have accrued lesser profits than if he had purchased the stock at 0.88330. Of course, prices rise to the target of 0.91000, but rounded bottoms need traders to perfect the art of timing. Timing is very essential in using bullish reversal formations.
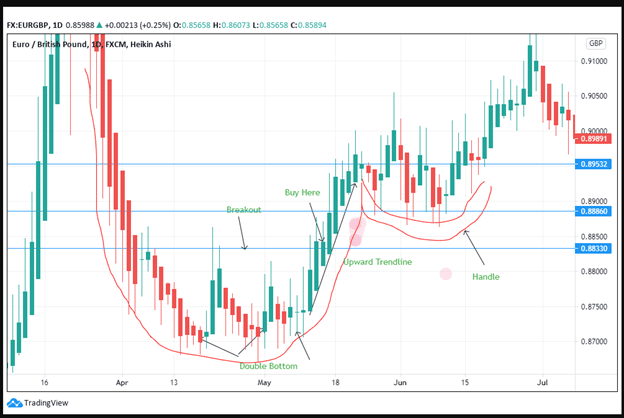
Figure 4: Cup with handle pattern within the rounded bottom
3. Buy at the handle
A true rounded bottom will, in most cases, have a handle. You can buy the stock once it hits the target. Limit the buy position to a handle position. The handle indicates a pull-back. In many instances, however, you do not have to sell at the handle, and the buy option is appropriate. You can wait for another breakout as the price regains its upward trendline. The handle is a sign that the stock will allow another retracement or a bullish reversal.
4. Stop loss
Place the stop loss option in every move depending on the price duration. For instance, when buying the currency pair at 0.88330 places the stop loss just below the handle. In figure 4, the stop loss should be at 0.88860.
Conclusion
The rounded bottom pattern shows the price movement and a reversal from a bearish to a bullish trend. Volume increases in the decline flatten out during the round bottom and gradually increases as the stock peaks in the upward trend (reversal). The pattern is very successful, but it is supported by other in-built patterns such as the double-bottom and the cup with handle. In trading, identify the neckline within the rounded bottom. Confirm the breakout before initiating a long position. Identify the handle position and put a stop loss below the handle. Ensure that you trade based on the range of the rounded bottom pattern.

