
In the financial markets, the Choppiness index (also known as the CI or CHOP) is a volatility indicator that determines whether the market is heading up or down or whether it is not moving in a certain direction (choppy market). CI is a directionless indicator, unlike other indicators that show price movement.

How the indicator works
CI provides a sense of whether or not the market is trending or moving sideways. There are several technical indicators that may be utilized in combination with CHOP to confirm any indications and pinpoint the price direction.
There are a number of ways that traders may utilize the CI to determine whether or not the price movement will continue to be volatile.
The Choppiness Index is a range-bound oscillator that takes values from 0 to 100. Higher values imply consolidation or sideways movement, while lower values indicate potential trending movement. To calculate the Choppiness Index, the real range values for a predetermined number of periods are used. Fibonacci ratios are widely used as a threshold for reading the CI indicator readings.
The top limit of the Choppiness index is 61.8. The CI indicator uses the value of 38.2 as its lower threshold. Trades may also examine the CI range’s middle point and the blue line’s relationship to that point, comparing it to the 50-point value.
On the trading platform, the Choppiness index indicator’s important parameters are:
A CI reading below 38.2 says the market is more likely to be moving in one direction, while one over 62.8 means the market is more likely to be moving in a horizontal, range-based trajectory.
Most often, points 62.8 and 38.2 are utilized to identify possible turning moments in the price action, which may include a breakout or a confirmation that an asset is engaged in a strong trend. With these levels, a trend following approach is used when conditions are less choppy, while a breakout strategy is used when conditions are choppier.
CI-based trading strategies
CI high and low thresholds
If the CI readings are extremely high or low, you should either buy or sell the breakout. Many experts will tell you to purchase or sell the asset when it breaks the 38.2 percent retracement of the CI. This is the primary trigger for the signal, but there is more to it if we dive a bit further.
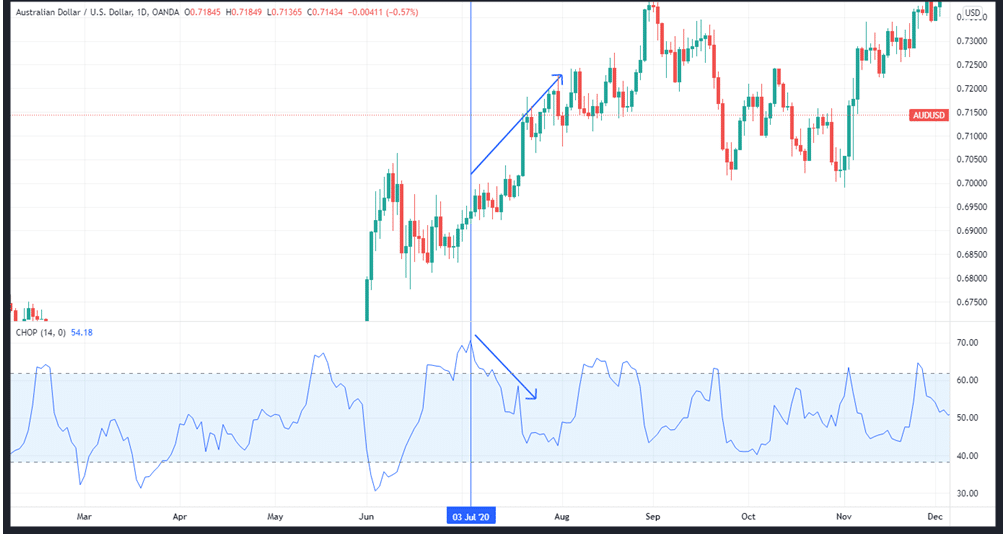
In the image above AUDUSD moves up, while the CI is declining, confirming a trending environment.
You may tell that the market is in decline if an asset continues to rise over the 61.8 percent level for a long time, for example. This means that instead of buying or selling the 38.2 percent retracement, another strategy is to wait for a fall back below the 61.8 percent level to signal that an uptrend is just beginning.
Trend-tracking strategy
With the CI oscillator, if it stays below the 38.2 threshold, it implies a strong directional trend. As long as it is below 62.8, a frequent strategy and approach utilizing the oscillator are to build positions in the same direction as the trend. A period of trending will follow if the consolidation continues for a long period. Furthermore, a protracted trending period indicates that consolidation is imminent.
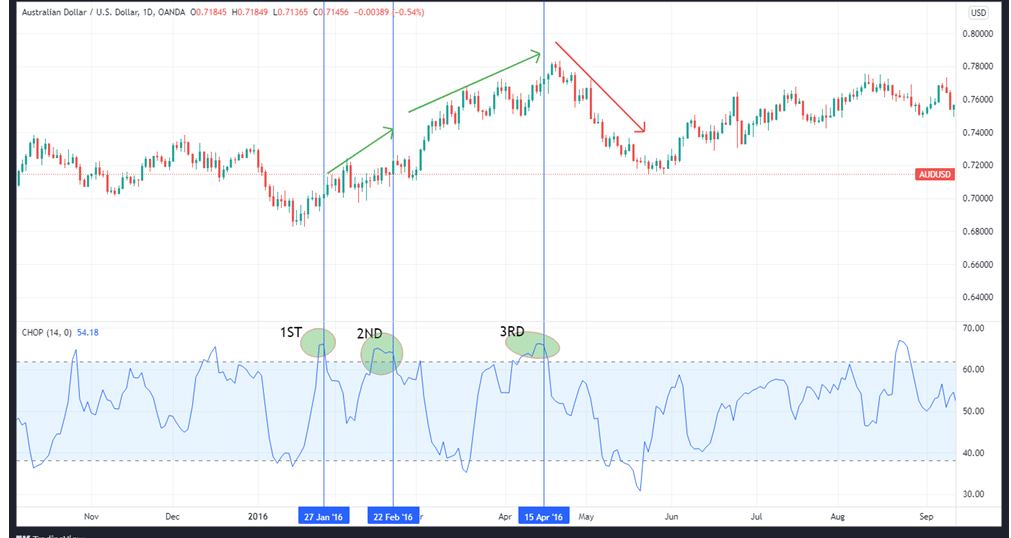
The 38.2 level is the optimum area to begin trend-following trades, both bullish and bearish. There is a long-standing practice of allowing three consecutive tests of the 62.8 level as a signal to quit trend-following positions (see the chart below).
Trading breakouts
Using the CI as a trading tool requires patiently watching for a move below the 62.8 level when the indicator is consistently above this level during periods of high choppy price action. An early sign of a breakout in the trend’s direction and the beginning of a new trend is seen when the price drops below the Fibonacci threshold.
Maintaining positions in the breakout trend is strongly recommended if the CI continues to fall below 38.2. To avoid losing money, you should abandon the trade once the index rises again over level 62.8. Upon passing below 62.8, the price moves from a sideways trend to a downtrend.
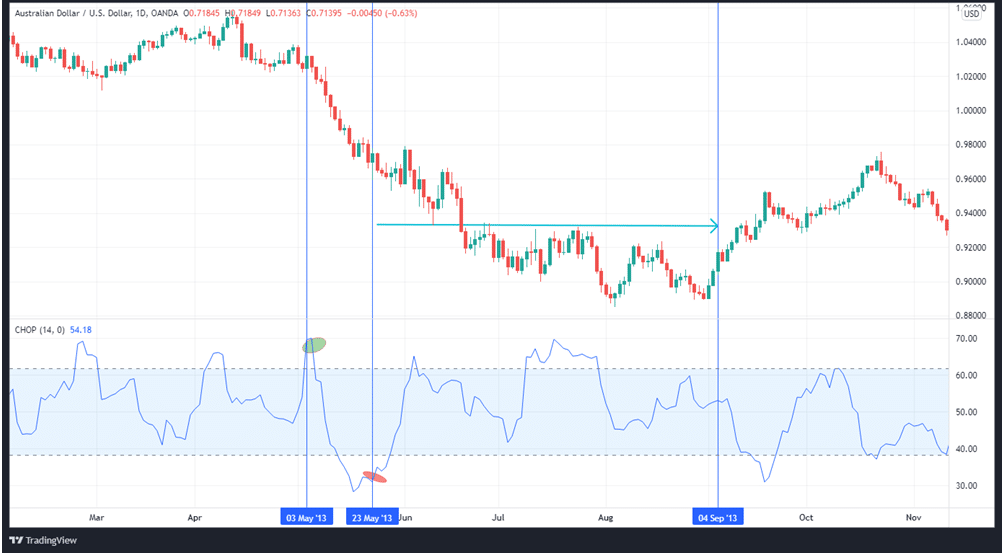
In the chart above, notice how the price choppiness changes once it crosses the 38.2 mark highlighted in red.
RSI, ADX, and the Choppiness Index
RSI, the CI, and ADX are used to give a buy or sell signal. When the following conditions are met:
- The CI falls below the 38.2 threshold.
- At the same time, ADX crosses the 20 mark from below it.
- The RSI is above 60.
In the chart below, we see how the price assumes a strong uptrend when the RSI, ADX, and CI cross the thresholds outlined above.
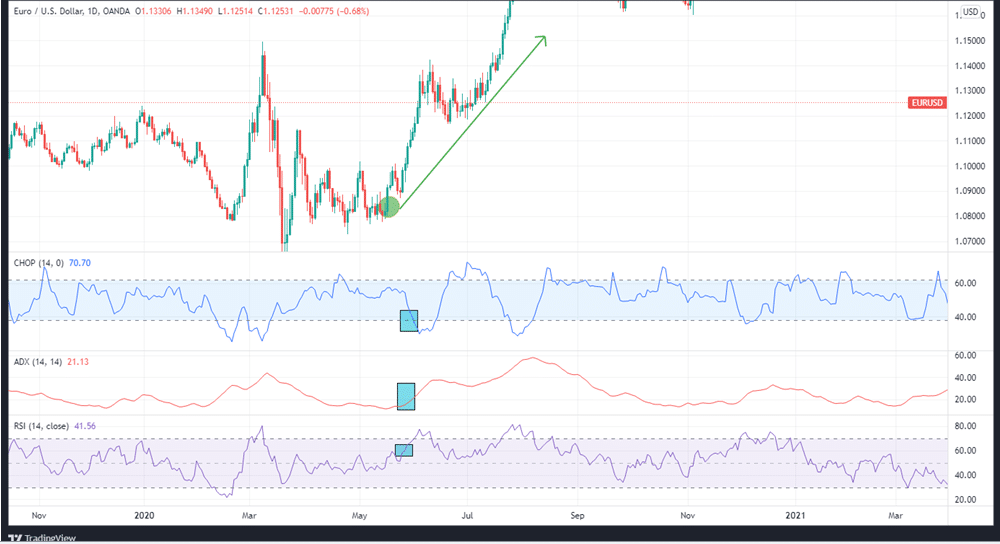
For the buy signal, the following requirements must be met:
- The CI should close under the 38.2 threshold.
- The ADX should cross above 20.
- The RSI should be above 40.
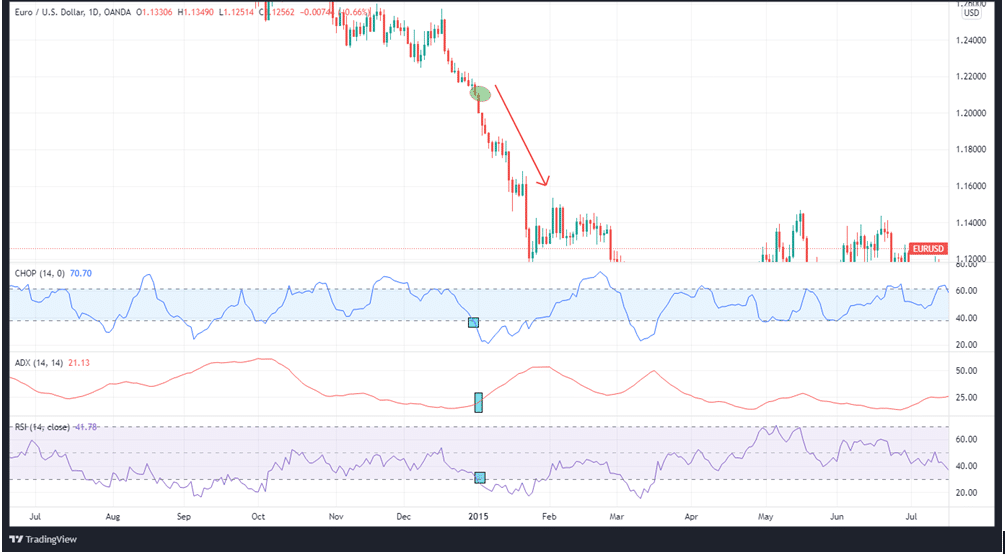
The chart above shows another downtrend signal when the RSI, ADX, and CI cross their respective thresholds.
In summary
The Choppiness Index is a useful tool for determining the ranges of a trend. A basic set of principles governs its operation, and its use is likewise simple. However, it’s impossible to tell when a trend will continue or when it will end. Like most technical indicators, the CI relies on price movement to show a trend is continuing or a breakout is taking place.

