Emotions play an important role in the financial market. This is why fear and greed are two of the most extreme conditions in the market. When investors are fearful, they tend to liquidate most of their assets and rush to the so-called safe havens. Similarly, when they are greedy, they typically move to riskier assets like emerging market currencies. This article will explain what the fear and greed index is and how you can use it in forex trading.
What is the fear and greed index?
The fear and greed index (F&G) is a tool that was built by CNNMoney to measure the overall emotions of market participants. The index is available on their website and is usually updated every day. It is built to oscillate between 0 and 100.
A drop to zero is usually a sign that there is extreme fear in the financial market, while a move to 100 is a sign of extreme greed in the market. The chart below shows what the fear and greed index looks like. CNN Money also provides a comprehensive chart that you can use to trade.
Fear and greed index chart
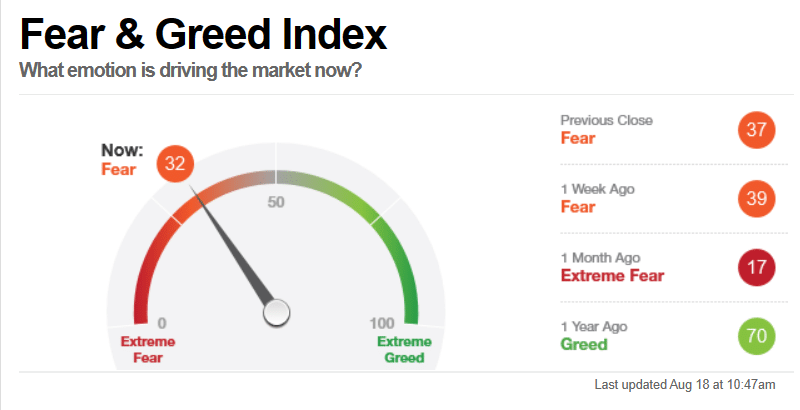
In most cases, the fear and greed index is mostly used by stock investors. Indeed, most of the sub-indices used to build the index are derived from stock indicators.
Components of the fear and greed index
The F&G index is a collection of several breadth indicators that track the sentiment of the financial market. These sub-indices are then added using different weights to create one index.
CBOE Volatility Index
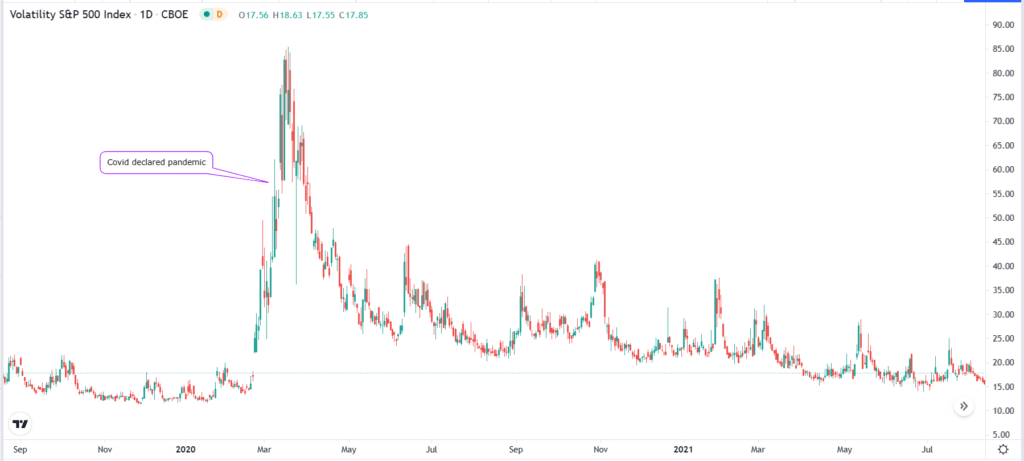
The VIX is a popular measure of volatility or fear and greed in the financial market. The index was created by the Chicago Board of Exchange (CBOE) and Goldman Sachs to measure activities in the options market of the S&P 500 index. The VIX tends to jump when there is substantial volatility in the financial market.
CBOE VIX index chart
The chart above shows that the VIX index jumped in 2020 when Covid-19 was declared a global pandemic. It then cooled as the global economy emerged from the pandemic.
Safe-haven demand
Safe havens are assets that investors typically run to when there are substantial risks to the economy. In most cases, investors tend to move to bonds and dividend or value stocks when there is a material risk in the market.
They also move away from riskier assets like growth stocks and emerging market stocks. The safe-haven demand sub-index in the fear and greed index looks at the performance of stocks vs bonds. Specifically, it calculates the difference in the 20-day stock and bond returns.
Junk bond demand
Junk bonds are often known as high-yield bonds. These are bonds that offer attractive returns but higher risks. In most cases, they include bonds of companies and countries with bad credit ratings. The junk bond demand sub-index looks at the yield spread between junk bonds and investment-grade bonds. When the index is down, it means that investors are pursuing higher-risk strategies.
Market momentum
There are several ways of looking at the market momentum in the stock market. One way is to use the Moving Average, which is one of the most popular technical indicators. The sub-index looks at how far the S&P 500 is above or below the 125-day Moving Average. When it is above the index, it means that investors are typically bullish on the stock market.
Put and call options
The next key sub-index of the fear and greed index is the put and call options. In this, the index usually looks at the CBOE 5-day average put and call ratio to determine the amount of volatility in the market. When the volume of put options lags the volume of call options, it is usually a sign that investors are bullish on the market.
The other sub-indices of the fear and greed index are the stock price breadth and stock price strength. The breadth uses the McClellan Volume Summation index, while the strength looks at the number of stocks hitting their 52-week lows or highs.
Using the fear and greed index in forex
While the fear and greed index is mostly applied in the stock market, forex traders use it as a gauge of sentiment in the overall market.
Therefore, if there is extreme greed or when the index is on an upward trend, it is a sign that investors are getting greedy in the market. As such, it incentivizes what is known as a risk-on approach in the market. This is where investors move from safer currencies to high-risky ones such as those from the emerging market.
Some of the most popular emerging market currencies are the South African rand, Brazilian real, and Turkish lira. The chart below shows that the South African rand maintained a bullish momentum in 2020 as the VIX index rose to a multi-year high.
USD/ZAR performance in 2020
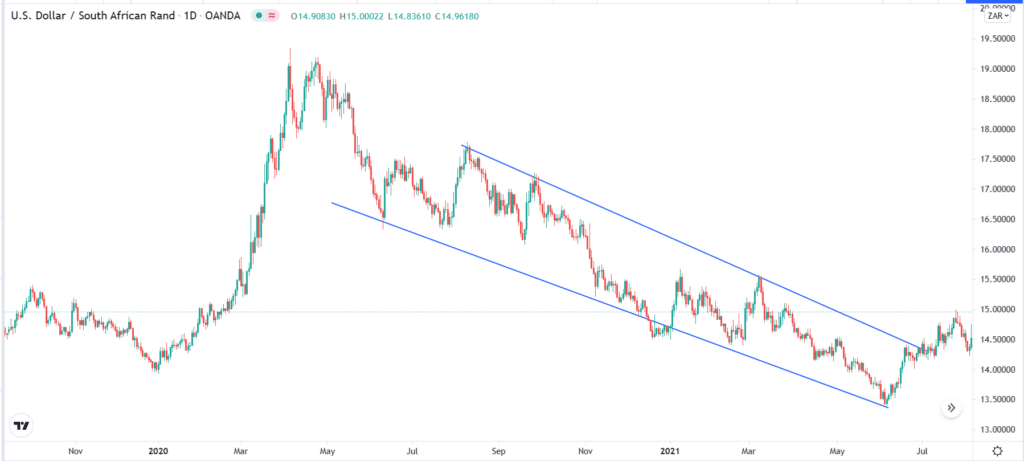
Meanwhile, when the fear and greed index declines sharply, it is usually a sign that investors are getting fearful about the market. This fear is usually triggered by several factors such as a central bank decision, weak economic data, and political situations. When this happens, forex traders tend to move to the so-called safe-haven currencies like the US dollar, Swiss franc, and the Japanese yen.
Fear and greed index plotted on US dollar index.
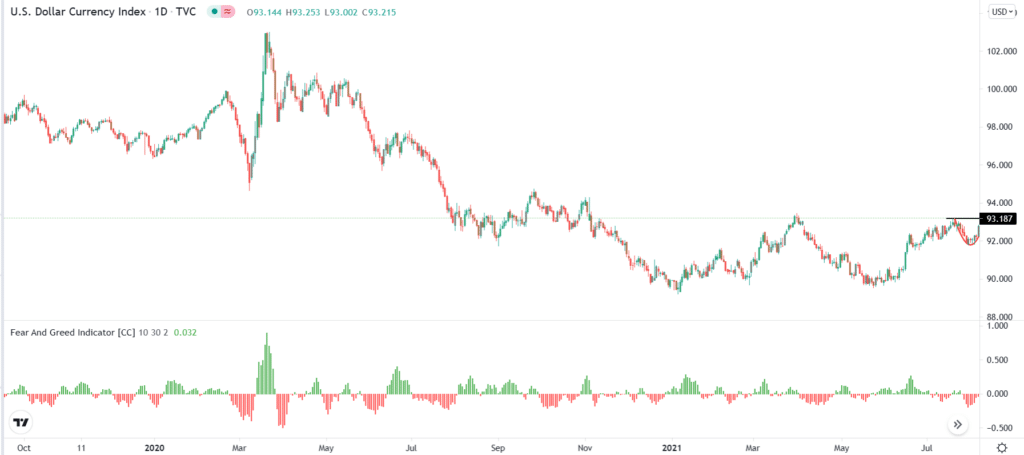
The US dollar is usually a safe haven currency because of the stability of the US economy and the fact that the country has a stable banking industry. The Japanese yen is viewed as a safe-haven currency because Japan is one of the biggest holders of US treasuries. The chart above shows the fear and greed index applied on the US dollar index chart.
Final thoughts
The fear and greed index is an easy-to-use tool that is ideal in giving you the overall sentiment in the market. The index can tell you what investors and other market participants are doing. As a result, it can give you more clarity on where you should allocate your assets.

