TradingView is a popular website that many people in the investing and trading industry use. The company was started in 2011 and has grown to become a leading destination for more than 15 million people every month. In this article, we will look at the best strategy to use TradingView as a professional forex trader.
What is TradingView
TradingView is a company that started as a purely financial social media company. Over the years, the developers have improved the website to include hundreds of tools to help traders do well. The company has raised more than $40 million from investors, according to data compiled by Crunchbase.
Like other trading tools, the website uses a freemium model, where it offers certain tools for free and locks others behind a paywall. Still, as an ordinary day trader, there is no need for you to upgrade to the premium versions since the items in the free version are just fine.
Charting in TradingView
One of the most popular tools in TradingView is its chart. If you have read market analysis articles online, chances are that you saw charts provided by the company. As a trader and analyst with more than a decade in the industry, I have not seen a company that offers comparable charting tools.
TradingView charts are easy to use and are highly customizable. It offers multiple types of charts like candlesticks, line, bar charts, Renko, line break, Kagi, and range, among others. Some of these chart types are not available by default in most trading platforms like MetaTrader. Therefore, as you craft your trading strategy, we recommend that you try using some of these charts to identify the best ones for you.
Also, TradingView offers many technical indicators that are not provided by default by most trading platforms. It has popular indicators like the Moving Average, Relative Strength Index (RSI), and the MACD. It also has many indicators that are not found in most platforms like Chop Zone, Linear Regression, and Zig Zag. Most importantly, it has other custom indicators that are developed by members of the community.
Charting tools offered by TradingView
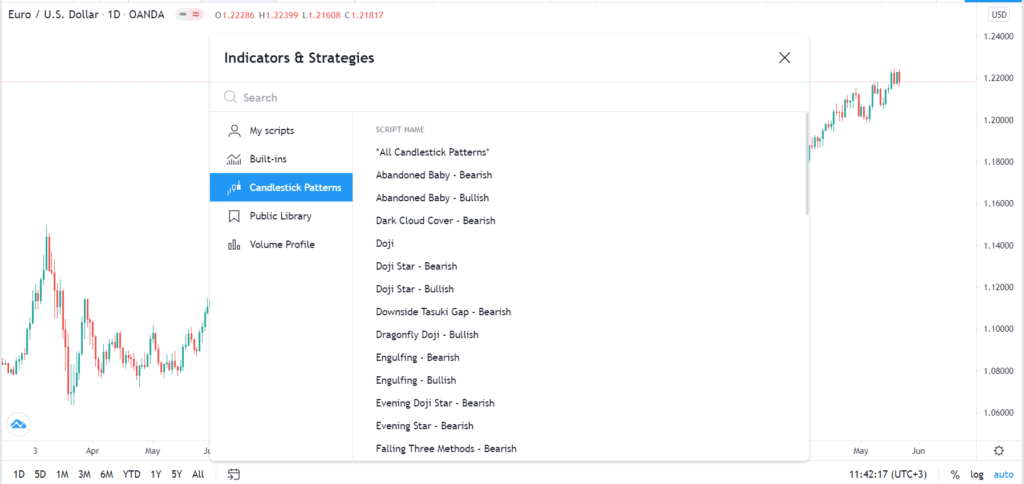
Recently, TradingView developers added simple tools to identify candlestick patterns like Bullish Engulfing, hammer, doji, and morning and the evening star.
Other charting tools in TradingView
TradingView also offers other charting tools that are popular among day traders. While some of these tools are provided in MetaTrader, the ones offered by TradingView are better to use. In fact, many traders I know tend to do their analysis on TradingView and then implement their trades elsewhere.
Some of the most popular of these tools are the Fibonacci Retracement, Andrews and Schiff Pitchfork, Gann Box and Gann Square, and Fib Channel.
Trading tools in TradingView
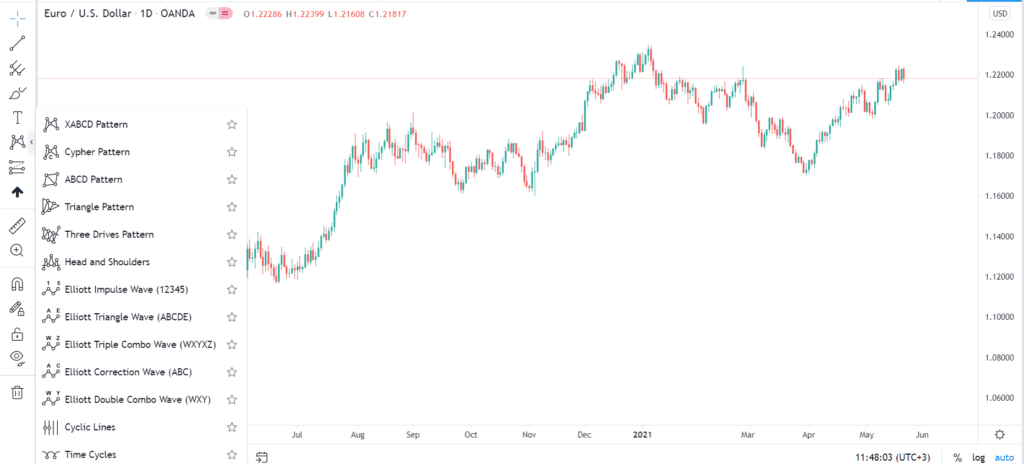
It has also simplified chart patterns like the XABCD, Cypher, ABCD, Elliot Wave, and the Head and Shoulders. Therefore, as a forex trader, we recommend that you use these tools in your analysis and then implement the trades either through TradingView or through your broker.
Chart pattern analysis tools
Many price action traders focus on chart pattern analysis. This includes looking at patterns like the head and shoulders, bullish and bearish pennants and flags, triangles, cup and handle, and rectangles. Others use harmonic patterns like the butterfly, cypher, crab, and three-drives. Looking at these chart patterns can be a difficult thing, especially when you are a new trader.
Most professional forex traders use the power of TradingView’s community to identify these patterns.
Triangles in TradingView
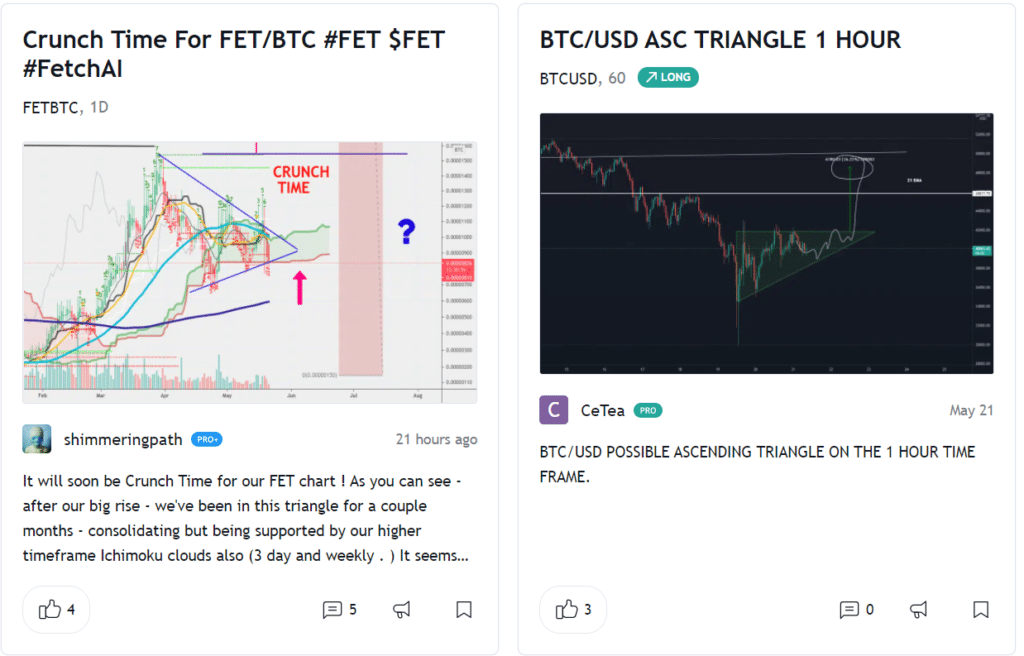
For example, if you want to identify currency pairs or other assets that have formed a triangle pattern, you can find them on this page, as shown above. After finding the assets with the patterns you like, you can then do more digging about them.
Robots development
A good number of professional traders have embraced the concept of robo-trading. This is a strategy where they create software that will automatically open and close trades for them. Others create robots that will send them automated alerts when certain market conditions are met.
TradingView offers one of the best platforms to develop robots. It has developed a language known as Pine Editor that is relatively easy to use for people with a coding background. Further, the platform has hundreds of scripts that you can use to build these bots.
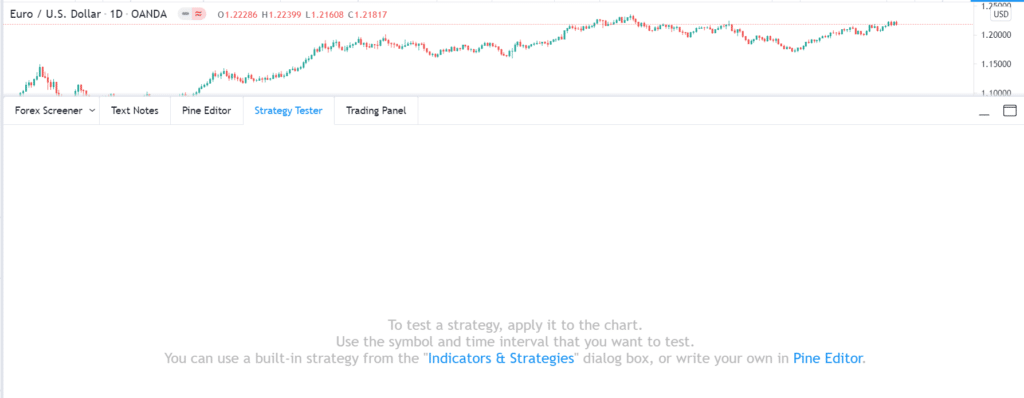
Most importantly, it has an advanced tool to backtest these robots. Therefore, you can develop a robot and backtest it. Alternatively, you can download one of the scripts and test them, as shown above.
Watchlist
As a forex trader, having a watchlist can help you see what is happening in the financial market. For example, you can see the currency pairs that are surging, those that are flat, and those that are falling. With this information, you can easily identify the best pairs to focus on without looking at them individually.
TradingView has a watchlist tool that is relatively easy to use and one that most professional traders use. For example, in the chart below, we see that the EUR/USD has dropped by 0.38%.
TradingView watchlist
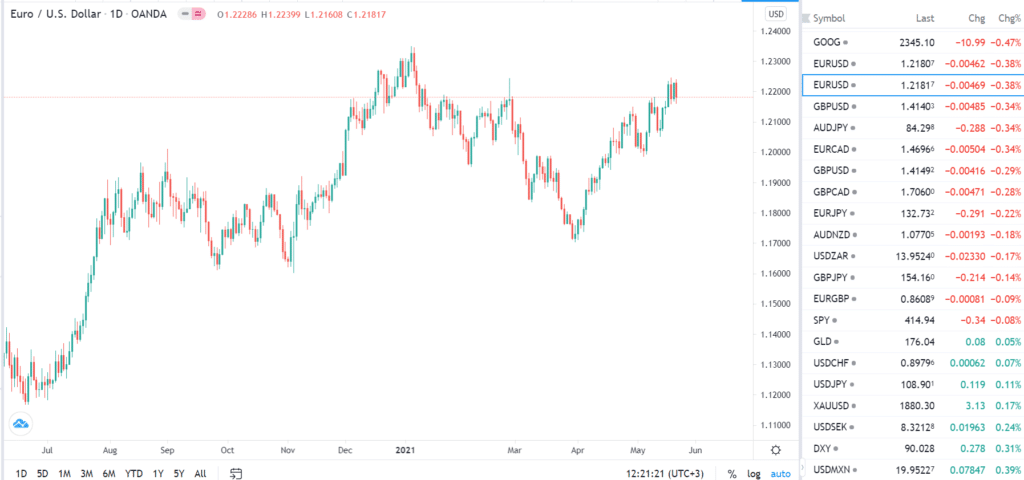
If you are just starting your day, you can easily know that something is happening. Also, you can use the alerts tool to receive personalized alerts when something happens.
Summary
There are many forex chart platforms on the internet today. However, as an experienced trader, I believe that TradingView offers some of the best easy-to-use tools for any trader to perfect their skills. It is a free platform that anyone can use.
Also, the developers have made it compatible with most devices, including smartphones and tablets. Other features it offers are an economic calendar, a chat platform, and Stream – a platform where you can see other day traders do their trading.

