
VWAP is a tool that is suitable for day traders and intraday traders in general, owing to its accuracy in identifying exit-entry opportunities in a short-term timeframe. Because cryptocurrencies and forex markets are both subject to price volatility, traders are always seeking methods to profit. VWAP trading aids traders in determining when to buy or sell. VWAP is very useful since it takes both price and volume into account.

What is VWAP?
It is a widely used indicator that is computed by dividing the average share price of an asset (crypto or forex) by the total number of shares traded over a given time period. This metric aids investors and analysts in evaluating an assets current price and determining if it is overpriced or underpriced in comparison to the day’s average trading price. This information is frequently utilized to make it easier to enter or exit a position.
The VWAP is also used as a metric to assess the quality of large-order executions. For example, if you want to buy a large number of cryptocurrencies such as Bitcoin but also want to acquire them at a lower price than the day’s average, the VWAP is usually the price to beat. In other words, placing a purchase order below the VWAP price effectively buys the asset at a discount. When using higher timeframe charts, such as daily or weekly, VWAP is not as effective.
Calculations
Formula
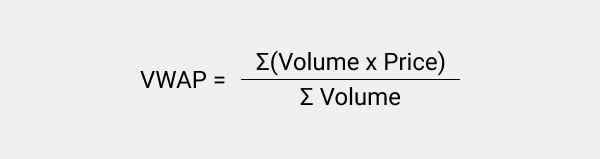
Steps
Step 1: Determine the typical price for the period. This is computed by summing the high, low, and then close and dividing by three the sum – (High + Low + Close) / 3
Weighted price – (High + Low + Open + Close) / 4
The difficulty with currencies is calculating the close because they operate 24 hours a day, Monday to Friday.
Step 2: Multiply the average price by the period’s volume.
Step 3: Determine the VWAP ratio of the numerator to the denominator.
How to apply VWAP indicator
To Identify overbought and oversold levels
The VWAP calculates average pricing for a given pricing level depending on the quantity of trading volume. As a result, the VWAP line can be viewed as a true average price.
It is considered overbought if the price is over the VWAP line. This is a good time to sell because the price of the crypto or currency is overpriced. It also shows that there is greater potential for a market correction.
On the other hand, if the price is below the VWAP, it indicates that the market is oversold and maybe a good time to buy. This does not prevent the market from becoming cheaper, but it is a better deal than buying at a high price.
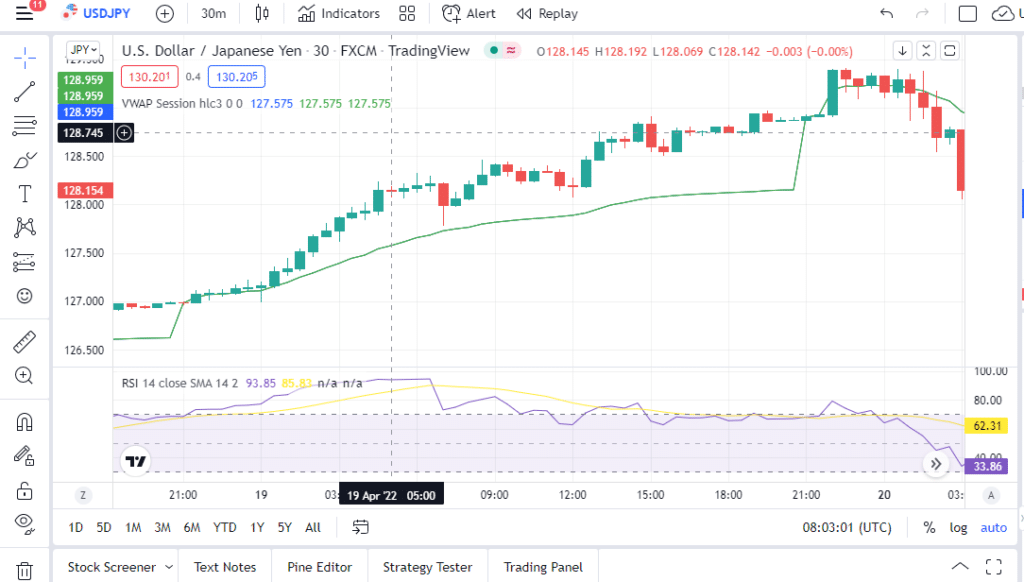
In the USDJPY chart above, we used the VWAP and the relative strength index (RSI). The RSI is constantly above 70, and the price is above the VWAP line. This shows that the pair is overbought, and it is a good time to sell.
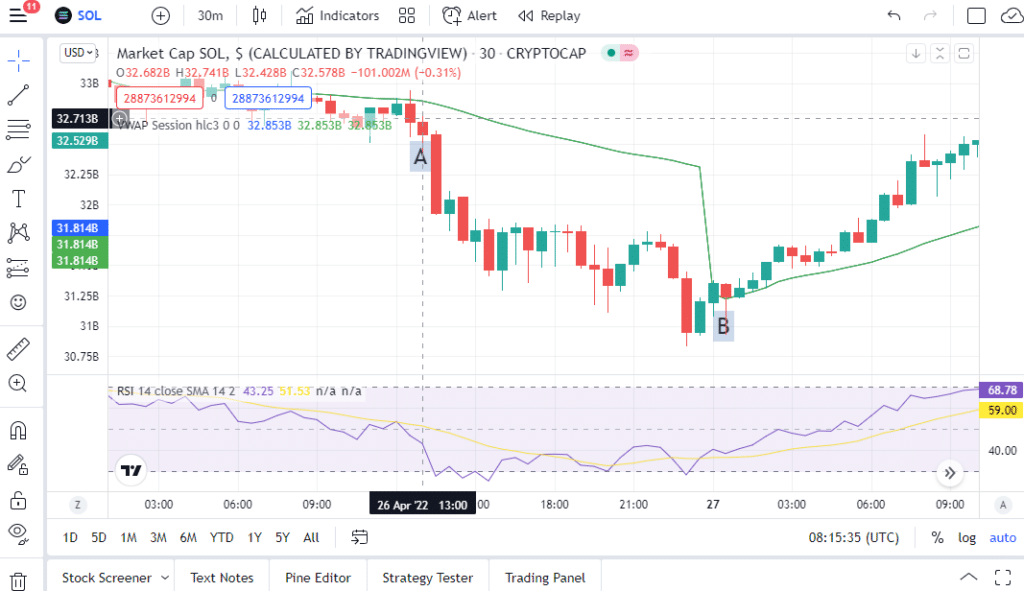
In the SOL chart above, we used the VWAP and the Relative Strength Index (RSI). From point A to B, the RSI is constantly below 30, and the price is below the VWAP line. This shows that the pair is oversold, and it is a good time to buy. Oversold conditions also show that the trend is about to change direction, which is observed in the chart in part marked B.
Pullback strategy
In this strategy, traders let the market move for a couple of candles and then wait for a pullback to the VWAP to go long or short with the trend, depending on the market’s direction.
This is an excellent place to enter a trade since you know that if it closes on the opposite side of where you entered, it’s time to exit and go on to the next one.
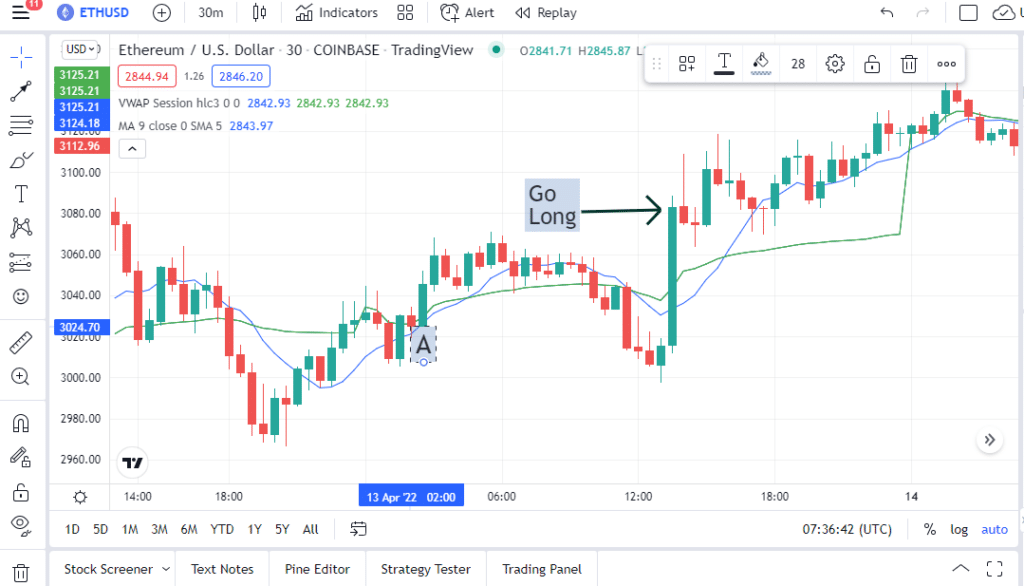
In the ETHUSD chart above, we used VWAP (green line) and 9-period Moving Average (blue line). One can decide to go long at the point marked A when the price was just above both the MA and VWAP. This strategy entails that you have to wait for the market to move for a couple of candles and then wait for a pullback to the VWAP to go long or short. After a few minutes, the price started going down, and then there was a pullback. It is now safe to enter the market.
Limitations
- It provides information about where real trading occurs, but it does so by looking backward rather than forward.
- It also tends to lag and gives the trader delayed input. For instance, if the price drops and then rises again, the VWAP may continue to rise.
- VWAP is calculated based on volume. As a result, when the market has prolonged periods of low activity, a range-bound sideways trading environment is likely. As a result, the signals provided by VWAP may not be accurate.
- The costs of making numerous trades will eat into profits. Each open position comes with a spread cost that the trader must pay. Because the market makers will take a spread for providing the quotations, you will not be able to close the position for a profit immediately after opening it.
Summary
Day traders frequently utilize the VWAP to determine intraday price changes. You may indicate where liquidity is and what price buyers and sellers are agreeing to be fair at a given time by monitoring it. It can also be used to see if the value of an asset is overbought or oversold. VWAP pullback approach can determine whether to go long or short. Like any other indicator, it has its limitations.

