Overview
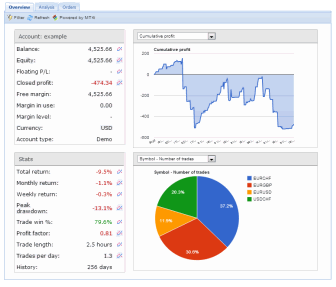
Trade result analytics platforms are popular applications for evaluating a trader’s performance and verify their results to other traders and investors. In the financial markets world where transparency is often lost, these analytics platforms act as the ultimate test to prove a trader’s results by reflecting some key performance metrics.

The primary metrics include profit and loss, equity, age of the trading account, swaps, drawdowns, and growth (daily, weekly, monthly). Other more complex investment ratios include metrics such as the Sharpe ratio, Sortino ratio, omega ratio, annualized volatility, and risk of ruin. Analytics applications automatically calculate these ratios with no need for manual intervention. These figures quickly gauge the skill of a trader. For example, the profit factor accounts for the gross profit divided by the gross loss for the entirety of the trading account. Any figure above one is considered very good from an investment perspective.
These platforms are also frequently used in live and demo trading competitions hosted by brokers, financial institutions, and even other traders. Prop firms or firms that look to fund traders also take advantage of these platforms as an excellent way to visualize their performance intensely. Many of these are free of charge, though others may require another commitment to access more features from the platform.
What makes these platforms so useful is they reveal the real results and activities of a trading account, which the technology updates as frequently as every minute. These applications allow for one to view all the main activities that occur in a trader’s account, such as all open and closed positions and deposits and withdrawals. This very attentive method allows for a ‘blow by blow’ analysis of performance that accounts for every single action that happens.
How trade result analytics platforms work
A trader will sign up for the service with an email address, username, and password. Using the server name, account number, and password of their existing trading account, this information will be inputted into the analytics platform to pull all the trading information. Usually, this information is available on the platform within an hour, though more sophisticated applications can take several hours to reflect all the data. Traders do not typically need to install any software or programs as the developers host these platforms online. For an outsider looking at a trader’s account, they can verify if their account is live or demo by looking at the server name of their broker.
For security reasons, the password that the trader provides to their platform is usually the investor password, which is a read-only function. Using this password, anyone can view their results without logging into their actual trading account and making any changes.
Best trade result analytics platform to use
Many of these platforms operate very similarly and are all held in high esteem amongst trading communities worldwide. Plenty of trade charting platforms are supported using these services, mainly MetaTrader 4, MetaTrader 5, and cTrader, but also xOpenHub, Vertex FX, FXCM Trade Station, Strategy Trader, etc.
Myfxbook

Myfxbook is not only a recommended analytics platform, but an all-round social network for participants of various markets where traders from around the world can discuss, among other things, different trading systems and the results of other traders’ performances. They also provide a financial markets portal that offers a wide range of useful market data and technical tools.
Regarding their existing analytics platform, Myfxbook is highly user-friendly, reflecting general stats from a distance and then more detailed charts that display the growth, balance, profit, and drawdown of a trading account.
FX Blue

Yet another well-known platform, FX Blue provides a few more advanced features than Myfxbook. The first outstanding feature is the ability for users to create their own widgets that would mirror all real-time activity on their trading accounts to visitors on their websites. Furthermore, FX Blue allows its users to create their own trading competition using their resources to rank the performance of traders systematically.
PsyQuation

Somewhat of a lesser-known analytics platform, PsyQuation prides itself as an AI-driven platform that was born out of extensive scientific research on the performance of traders. It has all the bells and whistles that Myfxbook and FXBlue does, but with a few unique features.
For one, the proprietary PsyQuation score intricately measures skill, behavior, risk, and history, and the users of the application can compare their scores against many others worldwide via a leaderboard. The same score is also one of the requirements for the funding program they have currently with the broker, AxiTrader. Their premium features, which do not require any financial commitment, give users a few other perks such as accessing the order flow of more than 28, 000 live trading accounts from AxiTrader. The only requirement for this feature is to open an AxiTrader live account. Overall, PsyQuation’s value proposition is a bit more bespoke than the rest.
Conclusion
There are several other platforms with similar functions, though the above three are the most popular and functional. Analytics platforms can be beneficial for any trader for both their performance assessment and also for verifying their results to other interested parties.


