Similar to moving averages, you can use the HMA indicator to point out when a trend is about to shift or confirm the presence of the trend in the first place. You can isolate trade entry points by using Hull Moving Averages having shorter periods. During a bullish trend, if you see the HMA advancing upwards, it is a great opportunity to place a long trade.

On the other hand, when there is a bearish trend and the HMA dips, you know it is a good time to go short. With most moving average types, traders look for crossover signals where the long-term MA is crossed by the short-term MA. However, experts advise against trading crossovers since it involves computing the difference in lag between the two MAs.
Since the purpose of HMA is to reduce the lag, most traders recommend monitoring the turning points to find out the points for entry and exit. When an HMA has a long period, you can use it to assess the nature of the overall trend. It is a bullish trend if HMA is advancing upwards, and if HMA is dipping, the trend is bearish.
- HMA Crossover
This strategy can be used for any pair during any session with a 1-hour chart. It’s a simple scheme where you need to look out for a confluence between the HMA indicator and the Oracle Momentum Indicator that comprises two lines that have a chance of crossing over.
For a long entry, you should look for a gold dot beneath the candle, and the blue line crossing above the red, both of which indicate an uptrend signal. The order should be placed at the point of confluence and the stop loss should be placed at the swing low beneath the candle representing the entry price. A trader should exit a long trade upon the appearance of a brown dot, and the blue line creeping beneath the red one – both of them indicate a downtrend signal.
For short entry, a brown dot must be present above the candle, and the blue line must cross beneath the red line, thus, signaling a downtrend. The trade should be entered at the point of confluence with the stop loss situated at the entry candle’s swing high. When there is a gold dot, and the blue line crosses above the red, it is an indication of an uptrend, and here you can make an exit.
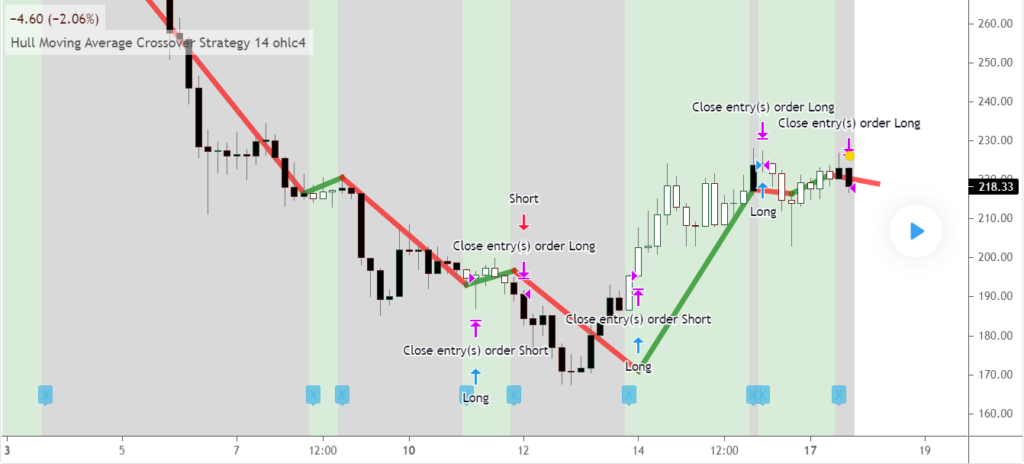
- HMA Swing
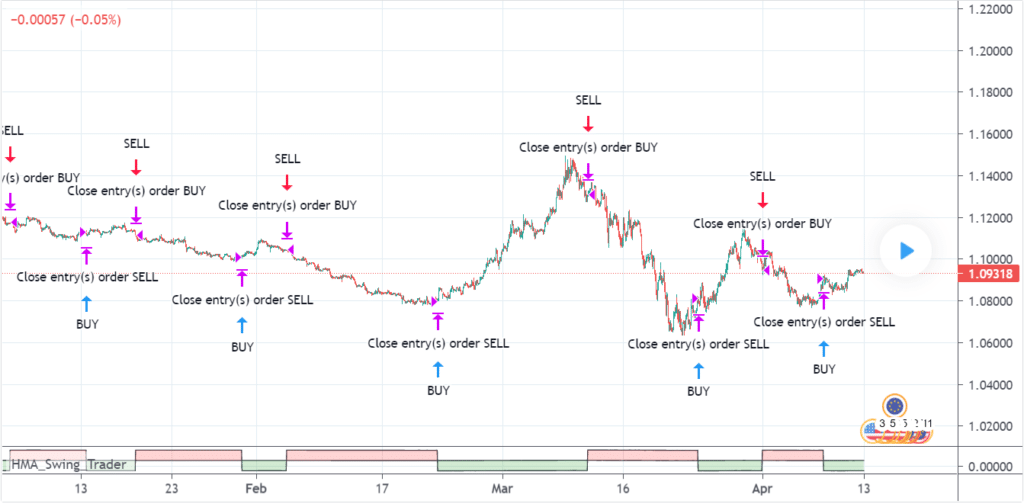
This strategy is ideal for the daily timeframe and it consists of two HMAs. The HMA80 and HMA50 are used for estimating optimal entry and exit points, respectively. When the trend is bearish, if the closing price for the day lies above HMA80, it is a good point to enter a long trade, because it indicates a trend reversal for the next few weeks.
Upon the trend shifting direction and becoming bullish if the closing price lies beneath HMA50, it is a good place to make an exit for a short trade, because it indicates the trend reversal for the subsequent 4-8 weeks.
Sometimes, fakeouts might occur, and it might give you a false signal of the trend shifting. When the trend turns bullish, we need to wait for the HMA80 to fall before trying to reach it. If you start from a great distance below, you can face a fakeout.
- RSI and Smothered RSI
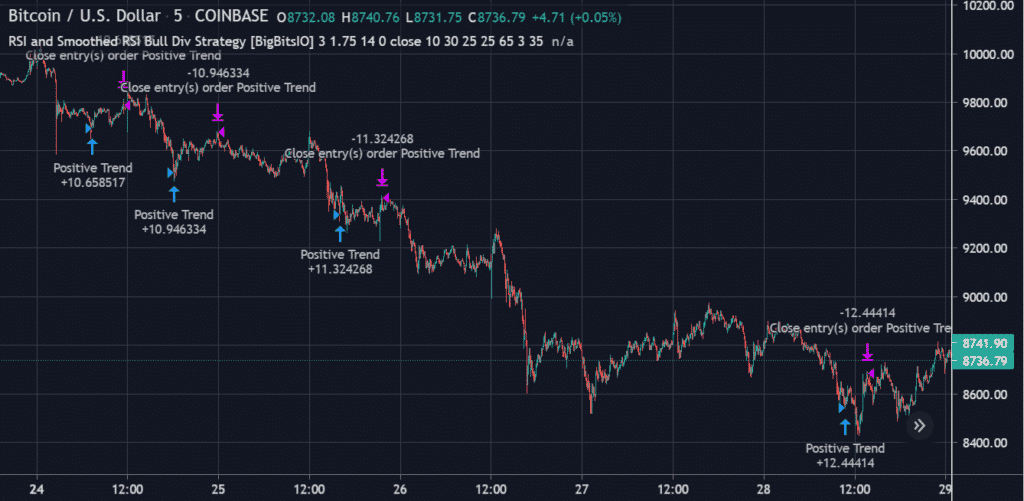
In this scheme, we concentrate on figuring out the low RSI value and try to trigger a long trade signal by targeting the low smoothed RSI when the price is less than the low RSI in the lookback period. On the chart, you can see the blue arrows indicating the points where the positive trends begin and the purple arrows indicating the points where you should close the entry orders.
The buy below percentage is the percentage change in price from the lowermost RSI candle in divergence lookback. Smoothed RSI Lookback period is defined as the number of candles that are required to calculate the Relative Strength Index (RSI). RSI Currently Below is the value below which RSI must remain in order to trigger a long trade.
- HMA VS Candle
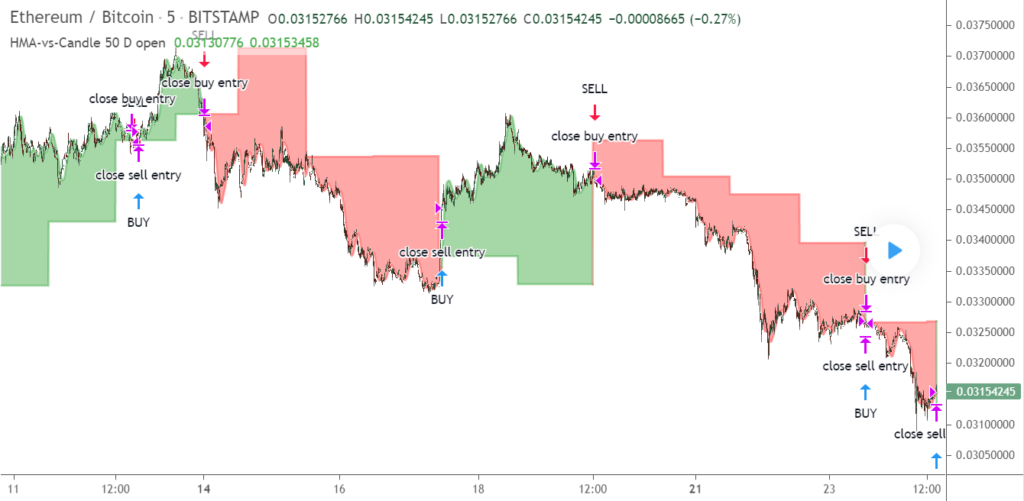
Here the HMA is used on a chart with the option of changing its period. The previous candle’s value is compared to the HMA, and if the HMA value exceeds that of the candle, it is a buy signal. Conversely, if the HMA lies beneath the previous candle, you should employ a sell strategy.
For this strategy, you should use a daily timeframe and an HMA period of 50. So if the value of HMA exceeds the previous day’s opening candle, you should enter a long trade. As a general rule, you should select a large HMA period for a small time frame, and a small period for a long timeframe.
- HMA + CCI
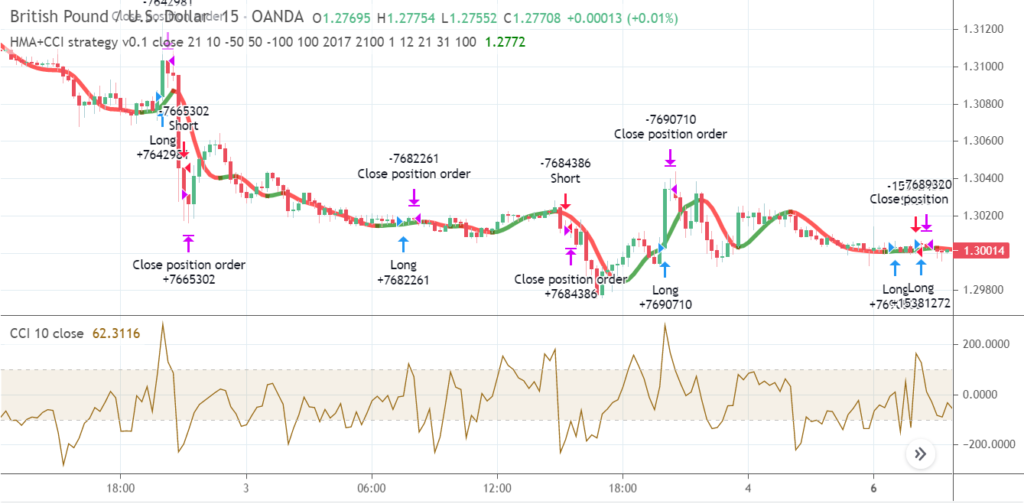
This strategy is suitable for trading in currencies like GBP/JPY, USD/JPY, and USD/GBP on a 15-minute timeframe. You can combine CCI (10) and HMA (21) for this purpose, with the levels situated at 0, 200, and -200. It helps you confirm a market trend using not one but two indicators.
First, you need to gauge the direction of the trend using the HMA indicator. After this, you can use the CCI for confirmation, i.e. if it intersects the 0 line and advances in the same direction as HMA. The periods of 21 and 10 will prevent you from entering the trade early, thus reducing whipsaw risk.
Summing Up
The similarities between the chart situations are as follows:
- More weight is assigned to the recent values.
- The moving averages remain in close proximity to the price bars.
- There may be fake out positions that can signal false trends.

