
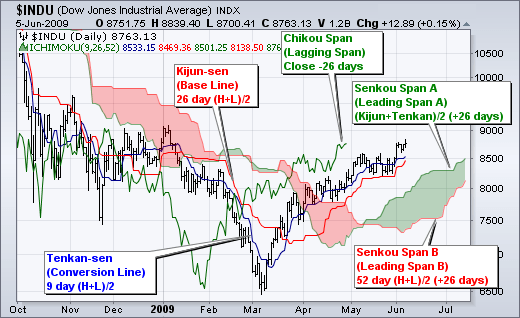
The Ichimoku Cloud indicator tells you the direction of the trend while indicating resistance and support levels. It’s created by two lines known as Senkou Span A and Senkou Span B, and the price’s location with respect to the cloud determines the trend. For instance, it is a bullish trend when the price lies above the cloud, and it’s a bearish trend when the price lies beneath the cloud.

The trend is considered to be sideways or flat if the price lies in the cloud. The Senkou Span A and B also influence the trend’s strength. A buy signal is generated when Tenkan-Sen intersects Kijun-Sen and moves upwards. Conversely, a sell signal appears when Tenkan-Sen moves below Kijun-Sen.
MA, Ichimoku, and Bollinger Bands
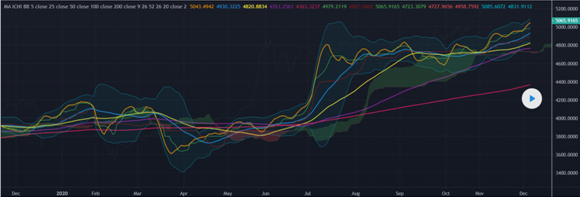
This strategy combines Moving Average lines with periods of 5, 25, 50, 100, and 200, along with Ichimoku cloud and Bollinger Bands.
By using this strategy, you can accurately determine shifts in the trend. You can say that a trend has shifted when the moving averages collide against each other, change trajectories, or attain certain levels. Trend shifts also occur when the Ichimoku cloud lies above or beneath the candlesticks and when the width of the BBs changes or they break their range.
You get a buy indication when the Ichimoku MA crosses upward, and a sell signal is generated once it crosses downward. You can place the first stop loss at the last high or low swing using the Ichimoku cloud as a trailing stop loss.
Kijun Sen
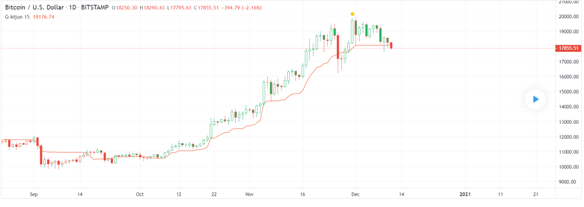
This trading strategy lets you determine the direction of the market accurately and place long and short entries easily. The pair used in the above chart setup is the Bitcoin/USD pair.
In the Kijun Sen strategy, if the closing point of the price lies above the indicator’s red line, the price trend is taken to be bullish, and you can place a long trade at this point. The stop loss should be placed one pip beneath the rising red line. For a buy entry, if the closing point of the price lies beneath the red line, you are advised to exit the trade.
When the price’s closing point is below the red line, the trend is said to be bearish, and you should sell the pair at this point. During the downtrend, if the price closes on top of the red line, it is an indication of the bears making their exits. Thus, you should take your profit and exit the trade at this point.
MACD + CMF + TSI + Ichimoku
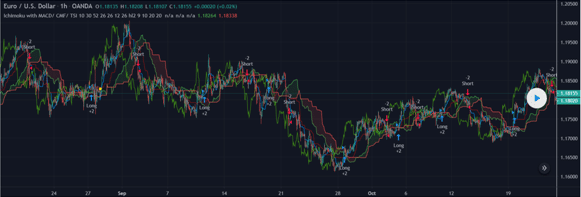
This strategy consists of the Ichimoku Cloud indicator, in combination with the True Sight Index, Chaikin Money Flow, and MACD. You can use it for any pair, but here we shall look at the EUR/USD pair for a time period of one hour.
There is nothing too complicated about this scheme. The buying and selling conditions for Ichimoku, like the intersection of the lines and the position beneath or above the cloud, are combined with the Moving Average Convergence Divergence histogram to assess the negative or positive level.
For True Sight Index and Chaikin Money Flow, the same condition is used. We need to check their positions with respect to the zero line. Buy and sell trades are placed based on this condition.
Upon the triggering of the subsequent option, the trade exit is made. For instance, when there is a buying signal, the trade is exited upon the appearance of a sell signal. The converse also holds true.
You can manage risks by placing take profit and stop losses.
Ichimoku Kinko Hyo
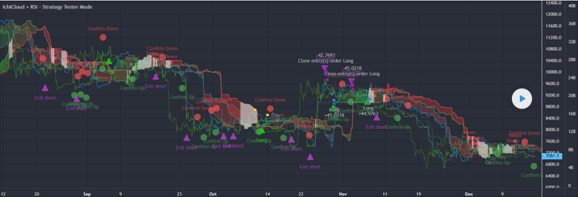
In this strategy, we combine the regular Ichimoku Cloud indicator with one not having the offset. Although this scheme works well alongside RSI when backtested using archival data, you can also use it as an independent system.
The green clouds are indicators of bullish trends, while the red ones depict a downtrend. When the cloud is wide, the trend is said to strengthen, and when it’s narrow, the trend is weakening. You should keep an eye on the Senkou Span lines to point out areas where the trend may reverse.
When the price of the asset lies above Kijun Sen, it indicates that the uptrend might continue, whereas the continuation of a downtrend is indicated by the price lying beneath the Kijun Sen. Using this indicator, you can point out an occasion where a market is ranging and identify exit and entry points using indicators like Stochastics and RSI that indicate oversold and overbought areas.
The exit points are depicted by the purple pyramids. The upward-pointing pyramids are for short exits, while the downward-pointing ones are for long exits.
RSI Divergence and 200 EMA
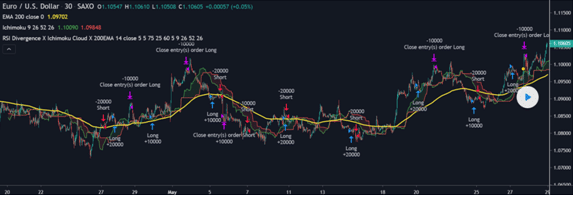
Here the popular RSI divergence scheme is used in combination with Ichimoku Cloud and a 200-period Exponential Moving Average. When an uptrending divergence is identified by the Relative Strength Index, and the Ichimoku Cloud lies above the 200-period EMA, you can enter a buy trade. This lets you confirm the uptrend before entering the trade.
Conversely, you can enter a sell trade when a downtrend is indicated by the Relative Strength Index, and the cloud lies beneath the 200-period Exponential Moving Average. Thus, the downtrend is confirmed before placing the trade.
Summing up
The similarities between the chart situations are as follows:
- They consist of five different lines.
- When the cloud advances with the price, the trend is said to be strong.
- The cloud can be used as resistance and support zones based on the price’s location with respect to it.
- The clouds can be used to point out crossovers.
- There is nothing predictive about these situations since they are based on archival data.

