The market is rife with uncertainty and figuring out patterns at a future date is much easier than when they actually occur. However, there are tools and techniques that make spotting real-time trends easier – one such technique is using the Keltner Channel. Here is why it is one of the most simple yet powerful trading tools available to help you comprehend market psychology, foresee the turning points, and improve your victory rate.
What is the Keltner Channel?
The market is rife with uncertainty and figuring out patterns at a future date is much easier than when they occur. However, there are tools and techniques that make spotting real-time trends easier – one such technique is using the Keltner Channel. Here is why it is one of the simplest yet powerful trading tools available that can help you comprehend market psychology, foresee the turning points, and improve your victory rate.
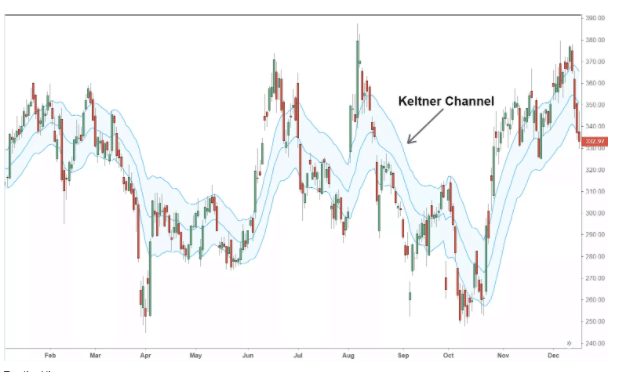
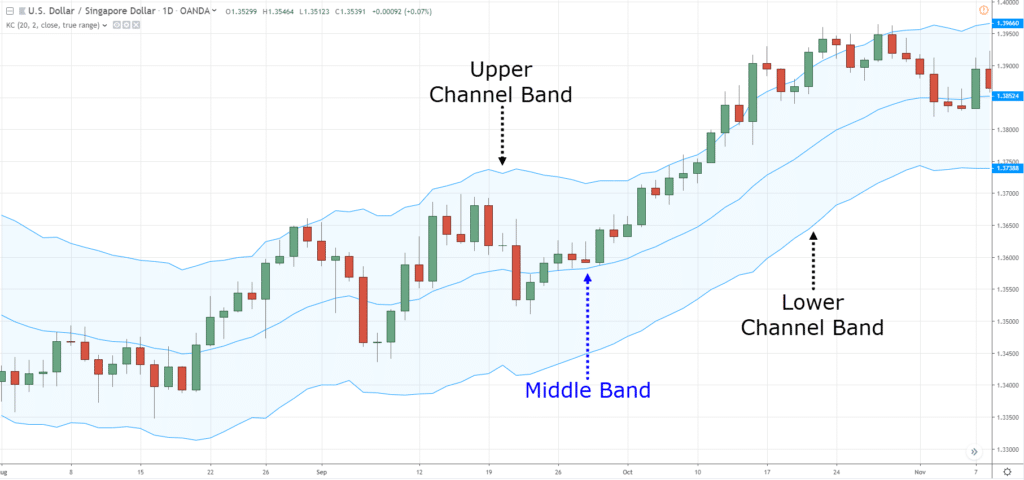
Chester Keltner first devised this volatility-based technical indicator in the 1960s. It has three bands, two on either side of the mean band that is situated in the center showing the price EMA, or the exponential moving average. It is, therefore, an envelope-based indicator. Being a trend-following indicator, the Keltner Channel makes the reversals and breakouts more distinguishable.

The Keltner Channel originally was introduced using the 10-day moving average (MA). However, the Keltner Channel popularly used now was later modified by Linda Raschke – the lines above and below the EMA form a range, which sets the channel’s width and is called the Average True Range. The upper band is usually set a couple of times greater than the EMA while the lower limit is set a couple of times below the EMA. The band above and below the mean band depict how far off the price is from the mean value. A change in these bands indicates either expansion or contraction when there is a change in volatility (measured by ATR). In simple words, it helps to spot potential overbuying and overselling of levels. You can analyze the curve and the EMA to distinguish the direction of the asset’s trend. Each direction – up, down, or sideways, reflects a change in the trend direction of the asset.

How to apply the indicator?
Keltner Channels are a blending of a pair of 2 indicators – the Exponential Moving Average (EMA) and the Average True Range (ATR).
The MA can be defined as the average price for a certain number of periods. The exponential inequality gives more priority to the latest prices and a lesser preference to ones that date back many days. On the other hand, the true average range is a measuring factor introduced by J. Welles Wilder Jr. It depicts the stark difference between the prevailing high and the prevailing low.
You can arrive at the ATR when you subtract the absolute value of the prevailing high from the previous close. Similarly, when you take away the absolute value of the current low minus the previous close, you get another ATR. Experts assert that this value is dynamic and is prone to vary within a fortnight.
The values you need for a trade
There is also a comprehensive formula that you can use to estimate the values of trade. These three mandatory values are:
- Upper Band = EMA + (ATR x multiplier)
- Middle Band = EMA
- Lower Band = EMA – (ATR x multiplier)

You can select which EMA period you want. Commonly for day trading, the exponential moving average lies between 15-40. There is a multiplying coefficient that is used in this calculation and the value of that ATR multiplier is 2. This implies that the upper band will be outlined two times the ATR above the EMA. Similarly, you can consider two times ATR for the band below it. The higher the coefficient, the bigger the channel gap and vice versa.
But this multiplying coefficient is not bound to remain constant. Traders can choose to modify the value according to their own choice, keeping in mind the asset that is being traded. Instead of choosing 2, you can go with any value that is close to 2 but, on the contrary, will give you a clear picture of the market you trade.
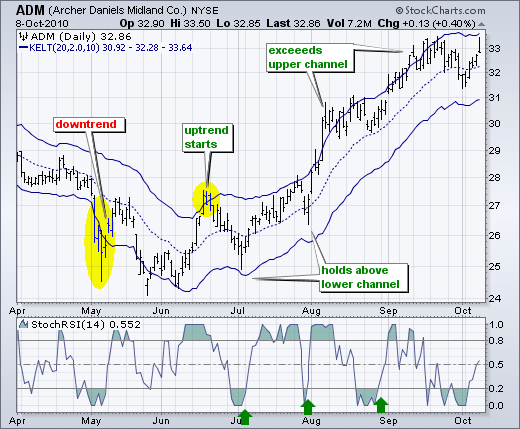
While you work with trends, you may notice an intriguing facet – that trades start with clashing moves against each other from either direction. Whenever you spot a giant wave in the upper channel line, you can assert that its strength is above par. On the contrary, you’ll observe a jaw-dropping plunge below the lower channel, representing weakness. Once you have this comprehensive picture, you can conclude which trend to consider and which one to rule out.
Drawbacks of using the Keltner Channel
Even though the Keltner Channel is quite sensitive to price fluctuations and can help you identify the direction of the trend asset, there are a few limitations to using it for technical analysis. Understanding these limitations is important so that you can accordingly adjust the settings and configuration you may have applied. You will need to understand the reason why you are using the channels and the ATR indicator and adjust the settings accordingly.
As is common with most indicators, the Keltner Channel also struggles when distinguishing between signals and noise. Keltner Channels have a weaker forecasting ability – seldom ensuring cracking trades. Through no fault of your own, this can be attributed to the combination of settings. If a glance at the graph tells you that the bands are extremely narrow or wide, know that the result of trading won’t be favorable. If the EMA is placed too low, you’ll spot the trend with ease but the channels won’t react to fluctuations in prices. On the other hand, placing the EMA quite short will make the trend harder to spot but the channels will take in the price changes very adeptly.
Another drawback is that there is no guarantee that the price is moving two ATRs or that hitting one of the bands will result in a profitable trade. There is no certainty that you can identify the trade direction as well.
However, this is true for most indicators. Keltner Channels still make for one of the strongest tools you can use. Just make sure to verify your findings with price-performance reports, traits of long-term trading, as well as other industrial indicators.
Final thoughts
In trading, trend identification is pivotal to decision-making. Once you have learned the skill to identify trends and to take action accordingly, half the battle is won. Keltner Channels are widely used to help the traders spot underlying trends and help you establish a trading preference and optimize your profits.


