Fundamental analysis is an important concept in day trading since it involves looking at key economic numbers in an economy. Some of the most common economic numbers that are considered are employment, retail sales, manufacturing and services data, and confidence index. In this article, we will look at what leading, lagging, and coincident (LLC) indicators are and how to use them in the market.
What are the LLC indicators?
A common challenge in economic analysis is the fact that multiple economic numbers can send different messages about the economy. For example, it is relatively common for data to show that the labor market did well in a given month while inflation weakened.
Therefore, economists have devised indices that provide a simple gauge of the performance of the economy. The three are delivered every month by the CB. This is a popular board that is best known for carrying out consumer confidence surveys.
Ideally, the leading indicators tell forex traders and economists what to expect in the future. Still, the indicator is known for having some very far-reaching components. Lagging indicators, on the other hand, are those that follow recent economic data. These ones are best known for confirming a turning point of an economy. The coincidence indicator tracks the turning points in the economic cycle.
To a large extent, these indices are similar to popular market indices like the Dow Jones, Nasdaq 100, and S&P 500. The three indices give a picture of what is happening in the stock market. For example, if the Nasdaq 100 index rises to an all-time high, there are high chances that many constituent stocks are rising as well.
At the same time, technical tools are also grouped into leading and lagging classes. Trend indicators like Moving Averages and Bollinger Bands are known as lagging indicators, while oscillators like the Relative Strength Index (RSI) and MACD are leading tools.
A key fact about leading, lagging, and coincident indicators are that they rarely move currency pairs and other financial assets.
Leading indicators (LEI) in forex
The LEI is an index that mostly uses economic flash numbers to forecast the future. The index is made up of ten flash indicators. When used well, the indicator can tell you a clear picture of the state of the economy.
The index is made up of ten key sub-indices. First, it looks at the average number of hours that are worked in the manufacturing sector. This data is derived from the monthly non-farm payrolls numbers that are usually published every first Friday of the month. Ideally, when the economy is doing well, you expect workers to spend more time at work.
Second, the index looks at the weekly jobless claims numbers. This is important data that looks at the number of people who are filing unemployment insurance benefits. The data is usually delivered every week. In a strong economy, the number of people filing for such claims is usually very limited. For example, at the height of the Covid pandemic, initial jobless claims jumped to millions.
Third, the LEI index looks at the trends in new orders in the manufacturing sector. Likewise, in a strong economy, the number of orders from manufacturers tends to be in an upward trend. As orders rise, these manufacturers will likely employ more and buy more input from local suppliers.
Further, the index looks at the performance of the housing market. Here, it looks at the building permits issued in a given month. In a strong economy, the number of building permits will likely keep rising. The building permits data is usually released every month by the commerce department.
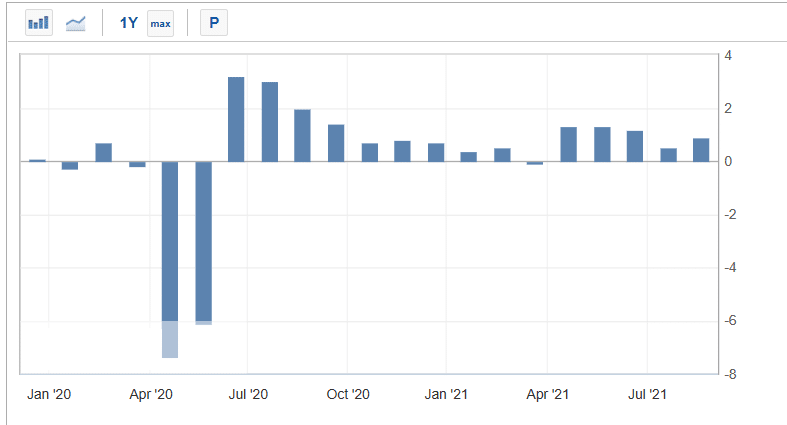
Other key components of the LEI are the performance of the S&P 500, confidence, and the interest rate spread between the 10-year and 2-year bonds. The chart below shows that the leading index declined sharply at the onset of the Covid pandemic and then made some modest improvements.

Leading index chart
Coincident indicator (CI)
The CI is one that provides the present gauge of the strength of the market. Unlike the LEI that has four key sub-indices.
First, it includes the non-farm payrolls numbers that are usually released every first Friday of the month. These numbers show all people who were employed in a given month in sectors other than agriculture. A higher NFP data is a sign that the economy is making a strong recovery.
Second, it includes the industrial production data in an economy. Still, the challenge of this data is that it tends to lag by a month. For example, while the NFP data is published for the previous month, industrial production has a gap.
Finally, the CI indicator has other numbers on salaries, manufacturing, and the retail sectors. These numbers tend to do well when the economy is making a strong recovery.
Lagging index
A lagging index is made up of economic data that follow an economic event. They typically give a clear picture of how the economy is doing. It is usually made up of seven key indicators. First, it looks at the duration of unemployment. When an economy is underperforming, the overall period it takes to get a job is usually relatively long.
Second, it looks at the labor cost, which is usually published when the non-farm payrolls are released. Wages tend to rise when an economy is doing well. Other key economic indicators in the lagging index are the average prime rate, inflation, and commercial and industrial loans that are outstanding.
Summary
These are important gauges of how an economy is doing. Still, while the numbers are important, they typically play a limited role in fundamental analysis. Instead, we recommend that you use these indices for reference. For most of your trading, you should use singular economic data like non-farm payrolls and inflation.


