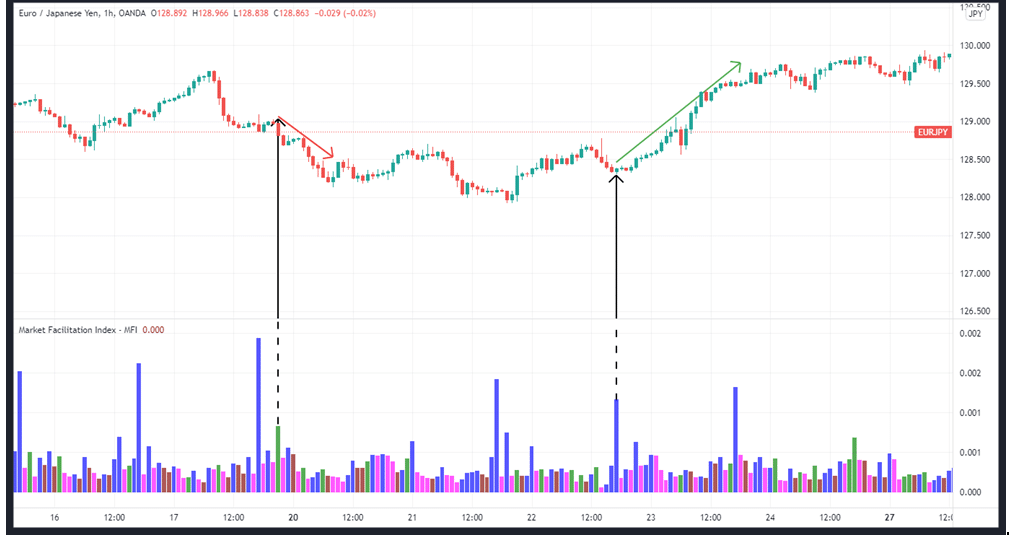
The brainchild of Bill Williams, the Market Facilitation Index (MFI) is an indicator that evaluates the strength of price changes as represented by each bar, based on the volume, the highs, and lows.
The MFI is calculated as (High-Low)/Volume
To determine whether a market trend is strong enough to consider trading, the index takes into account the following four factors:
- The green color indicates that both the MFI and the volume are increasing.
- Fade shows that the MFI and the volume are decreasing.
- Fake refers to a situation where the MFI is on the rise, but the volume of trade is decreasing.
- Squat refers to when the MFI is decreasing, but the volume is increasing.
The MFI differs from typical volume indicators in that typical volume indicators ignore price fluctuations and focus solely on the number of shares or contracts exchanged in a given market. In contrast, MFI goes the extra mile.

The price changes are taken into consideration, as is the volume of trades being conducted at the same time.
Interpreting market facilitation index
An increase or decrease in volume is generally considered an essential indicator by technical analysts. The MFI indicator shows how the market reacts to a change in volume in the underlying asset price. Analyzing the changes to the MFI indicator in contrast to the previous bar and changes in volumes compared to the previous bar helps traders better understand the current market conditions.
Both the MFI and volume up
In a rising MFI and increasing volume market, the market moves largely in one direction, but the number of market participants increases. When tick volume and the MFI both rise, it’s considered an excellent sign of trend continuation, and this is interpreted as a “green light” for market action.
It’s safe to assume that more money is entering the market when there’s a rise in volume. The rise in the MFI shows that the momentum of price changes is picking up speed. This is why following the market’s lead is a good idea in such a situation. When both the volume and MFI are up, the indicator’s default color on the MT4 platform is green.
Both the MFI and volume down
When both volume and MFI are down, it is referred to as a “fade.” Such a circumstance is a sign that nothing much is happening in the market because investors have lost interest in the current price action. An interval or gap between market swings creates this slowdown in trading activity, which could signal the beginning of a new buildup of momentum. In MT4, a fade has a brown bar as its default color.
MFI up and volume down
When the MFI is up and the volume goes down, we have the formation of a bar known as a “fake.” Although the market looks to be encouraging a move in one way, it is not backed up by volume. Price movements at this time should be treated with caution, as the movement is not supported by significant volumes of trading activity. In MT4, the MFI up bar appears in blue when the volume is low.
The MFI down and volume up
At times, the volume may spike while the MFI indicator heads down. This is known as a ‘squat.’ Analyzing these patterns reveals a strong battle between the sellers and the buyers, with high volumes of the asset being moved but with negligible change in price.
With the push and pull between the buyers and sellers still ongoing, we end up with no clear winner, and the market direction is also undefined. Ultimately, a winner will emerge, and squat may therefore herald the formation of a new trend or resumption of a previous trend.
The squat signifies the market’s readiness to leap. Squats are depicted in MT4 as pink bars.
Key takeaways
The following guidelines are key to successful trading using the MFI:
- When the MFI and volume both climb, it indicates that the market is moving largely in one direction, making it an excellent opportunity to enter the market.
- A simultaneous decline in volume and MFI indicates that investors’ interest is beginning to wane. This is a strong indication of an imminent end to a trend.
- If the volume is declining while the BW MFI is increasing, this is a clear indication that the market is moving largely in one way. However, it also indicates that the current price movement could be based on speculation because there are no new players entering the market.
- A rise in the MFI and a corresponding decline in the volume indicate a struggle between the bulls and the bears. In the end, the two market forces are so evenly balanced that the price does not change significantly. This is typical of a market that is about to change course. This means that once the bottleneck zone has been broken, the trader must pay close attention to the direction of price movement to know which position to take.
In summary
The MFI indicator enables traders to understand the correlation between an asset’s price and its traded volume.
This indication can assist in determining whether a signal is strong or weak and whether it will follow the current trend. MFI, therefore, makes it easier for users to track market changes. Therefore, understanding the relationship between price and volume can provide you with a considerable advantage in your current trading and investment environment.


