Investors often use the MACD to understand the correlation between the moving averages of an asset’s value. When the value keeps advancing upwards but the MACD moves in the opposite way, traders take this as an indication of a shift in trend. Several investors use this indicator only to get an early trend change forecast.
When the MACD moves above the signal line, it indicates a buy signal, and when it does the opposite, it indicates a sell signal. This gap is frequently represented with a histogram, which investors utilize to signal bearish or bullish market movements.
Histogram reversals
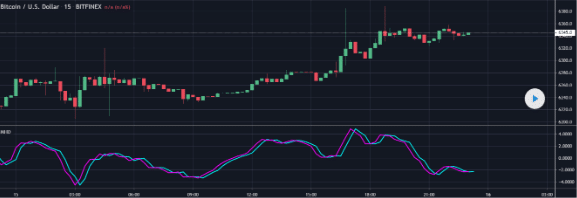
When the signal line and the MACD line move further away from each other, the histogram bars start putting distance between them and zero. When the histogram expands, it shows a positive price movement, and when it decreases in height, it indicates a momentum that is getting weaker.
After the conclusion of the expansion, you will be able to see a mound emerging, thus indicating that the MAs are returning to their tight structure. This is a tell-tale sign of a price crossover. This trading scheme allows you to use the trends and place your positions based on them. So, you can execute it before the market movement happens.
Because you are using the histogram to study movements that are opposite to the trend, there are fewer chances of false signals appearing. Thus, it can be a great tool for making trade entries. Exit points can also be identified as those where the MACD shows a movement in the other direction.
Exponential moving average
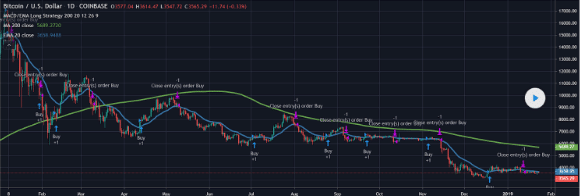
This is an easily executable scheme that combines the MACD with a 20 period EMA, letting you make entries and exits without taking too many risks. Using this, a merchant can determine whether the market is bearish or bullish by noting its position with respect to the 200 SMA.
When the market lies above 200 SMA, the buying indication provided by the 20 EMA is ignored, and the bullish MACD cross is taken as the sole buying signal. The sell occasion is enabled in this uptrending market only when the price closes beneath the 20 EMA, and the MACD is showing a downward movement. This helps in decreasing the chances of making a premature sale when the MACD cross is downtrending if the prices are still moving up.
In case the market lies beneath 200 SMA, you can authenticate the buy and sell criteria in the other direction. When the price closes above 20 EMA and the MACD is uptrending, the purchase condition will be satisfied. Nevertheless, the 20 EMA does not come into the picture when it comes to selling occasions, as the criterion for that is the downtrending MACD cross at the candle’s closing point.
Investors can use this scheme in both downtrending and uptrending markets. In an uptrending market, the performance may be a bit lackluster since the sale constraint is satisfied only sometimes. But, in a downtrending market, it allows you to avoid risks.
MACD + EMA + RSI
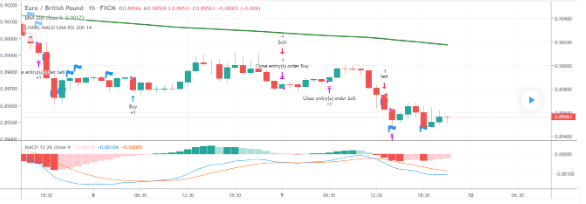
This strategy involves 3 EMAs, MACD, and RSI. The long trade entry signal appears when a new candle appears above the MAs, a second bar is made by the MACD above zero, and the RSI’s value line shifts on top of its trend line. This is the strongest when the value of RSI is more than 50, but it is not mandatory.
A short trade should be entered when the new candle opening lies beneath the MAs, the second bar of the MACD lies below zero, and the RSI’s value line shifts beneath its trend line. As per this strategy, a long trade should be exited when the RSI’s value line intersects the trend line and moves further down. The exit point for a short trade is when the RSI’s value line intersects the trend line, moving further up.
Trailing ATR stop
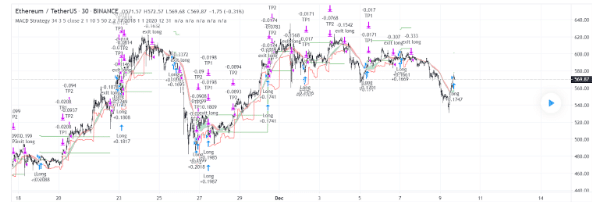
This trading scheme uses the SMA and EMA crossing for figuring out the direction in which the trend is moving. Additionally, it makes use of the MACD for pointing out the entry occasion. Simultaneously, the use of a trailing ATR stop is also important here.
When the MACD line crosses over the signal line and the trend ribbon turns green, it is a good time to enter a trade using this strategy. If the indication arrives once again, you can enter the trade once more. The total number of points where you can exit your trades is three. With a 1% rise in the price, the position’s initial 10% will be concluded.
Once the price attains the 5% target value, the second part of 50% will be concluded. Now there remains only 40% of the position’s initial value, and the closure of this occurs when the price closes beneath ATR, which is also the signal for exiting the trade.
Bollinger Bands
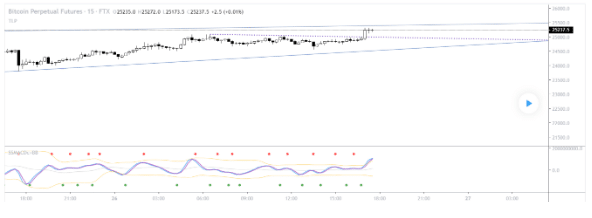
Here, traders confirm trading occasions by observing the performance of the MACD and Bollinger Bands (BB). At the instance when the price reaches the lower BB for a while and starts moving up, the MACD performance needs to be taken into account. An uptrend is corroborated when the MACD line intersects the signal line and advances upward.
On the other hand, when the price reaches the upper BB and starts reversing, and the MACD intersects the signal line moving downwards, it is a short entry signal. For the MACD crossover to be authentic, the candlesticks must conclude.
Summing up
The common factors between the above chart situations are:
- They allow traders to gain from trending and consolidating markets.
- They generate sell and buy signals based on the MACD crossing above or below the zero lines.
- They can be used to assess the strength of momentum.
- Oversold and overbought conditions can be detected through these.

