The NFP report is a crucial piece of economic data as it reveals how many new jobs were generated in the previous month. The NFP data only includes companies other than agriculture. Workers of farms and private households, government employees, and nonprofit organization employees are also not included in the NFP statistics. In other words, the NFP report is a reliable indicator of the health of the US economy.
The findings of the NFP report affect most major currency pairs, but one currency pair, in particular, gets the attention of traders – the GBPUSD. Due to the forex market’s 24-hour nature, all traders have the opportunity to profit from NFP news events.
The strategy operates on the premise that the market recognizes the information’s significance and reacts just before its release and after digesting it. Following its release, it does not take long before investors start taking positions in the direction of momentum. Following an initial fluctuation, they will look to determine the dominant trend. When the market sets a direction for exchange rates, they wait for a signal to know which way to go.
The NFP report receives so much interest that commentators from all over the financial world try to anticipate its outcome and effect on a range of financial instruments.
The strong response is attributable, in part, to the Federal Open Market Committee’s twofold mandate of ensuring maximum employment and stable prices. The maximum employment portion of the duty implies that the Fed uses NFP to assist set future interest rates, which has a significant effect on the economy’s health. If employment growth is robust, the Fed will likely increase interest rates if inflation remains stable, and vice versa if job growth is poor.
How does the V form?
Economic data releases usually result in fairly straightforward market results. For instance, if the expected increase in GDP growth comes at a faster rate than previously estimated in Australia, the Australian dollar (AUD) will most often grow. As opposed to this, the NFP report is well known for its “V-shaped” reversals, in which the market begins by spiking in one direction before quickly reversing in the following 10 minutes to 2 hours and repeating the process.
How to trade the V?
When initially released, take the market’s reaction into consideration but don’t bother anticipating the NFP number because that will likely not help. Instead, just hang tight until after the initial volatility has dissipated. Thereafter, look for the V-shaped reversal that could offer an excellent risk-to-reward ratio on a trade.
Although a reversal may not be so apparent, even a reversal of 33% may be profitable if a trader uses a high risk-to-reward ratio. Traders should look for a reversal candlestick pattern on the 5-minute chart to increase their chances of catching a reversal.
Working example
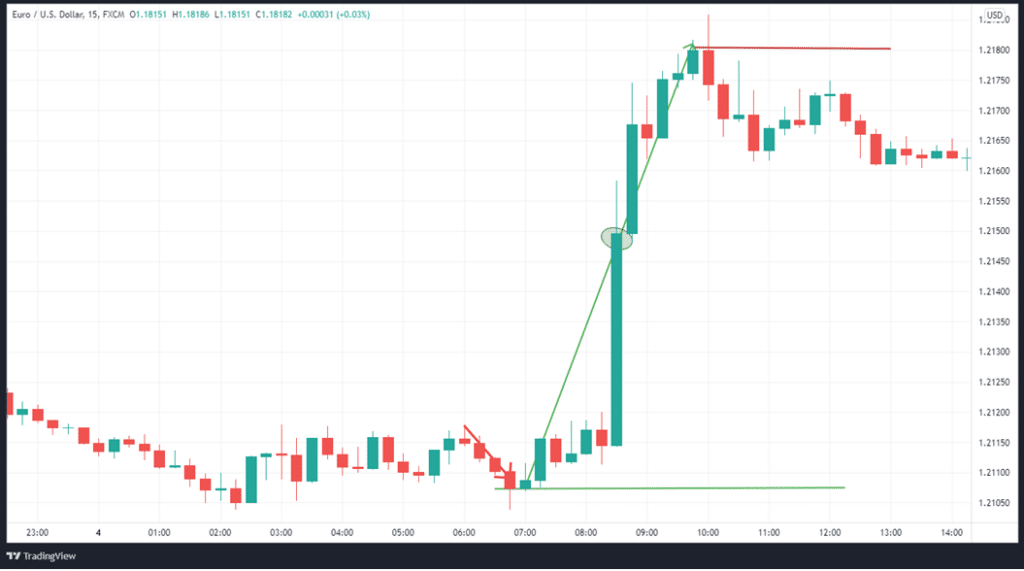
Consider the chart below as an example. The June 4th, 2021 NFP report, which indicated the creation of 559,000 jobs, was below the projection of 650,000. Following the news release at 8:30 EDT, the USD weakened, and EURUSD rose by 73 pips in the next 2 hours and 45 minutes. This was followed by a bearish pin candle, which was interpreted as an indication of a decrease in buying pressure.
We can see that an area of resistance and support developed shortly before the release of the NFP at positions just before the horizontal green line. This was due to a sell-off that occurred just before the release, presumably because the market anticipated a big figure from the US.
However, we already knew the data was lower than expected, and we should have expected the dollar to begin losing momentum. On some of the candlesticks, we can see tails forming, as well as a typical V shape, which happens throughout this occurrence.
When price action goes upward, as indicated by the following green candlesticks, the next trading opportunity arises.
Keep in mind that the timing of this data’s release is contingent on how the market interprets it. It’s possible that the data is terrible but not as bad as anticipated, or that it’s excellent but not as good as expected. As a result, it’s not a good idea to enter a trade only a few minutes before or after this crucial data release.

In the chart above, a trade was taken when the candle closing price (1.2115) was reached, and a stop loss was placed below the low (1.2107) just before the release. Thankfully, the trade worked out, and a profit of 73 pips was realized.
This style of trading could give you trades with high risk-to-reward ratios, enabling you to trade NFP without guessing at the number or its market impact.
In conclusion
NFP is a key indicator of the performance of the US economy. The V shape can create a conundrum for traders, but it can be correctly interpreted using the approach discussed above.


